
Everythingyou always wanted to know about the Uruguayan Truco
The not-so-Rioplatense origins of the game
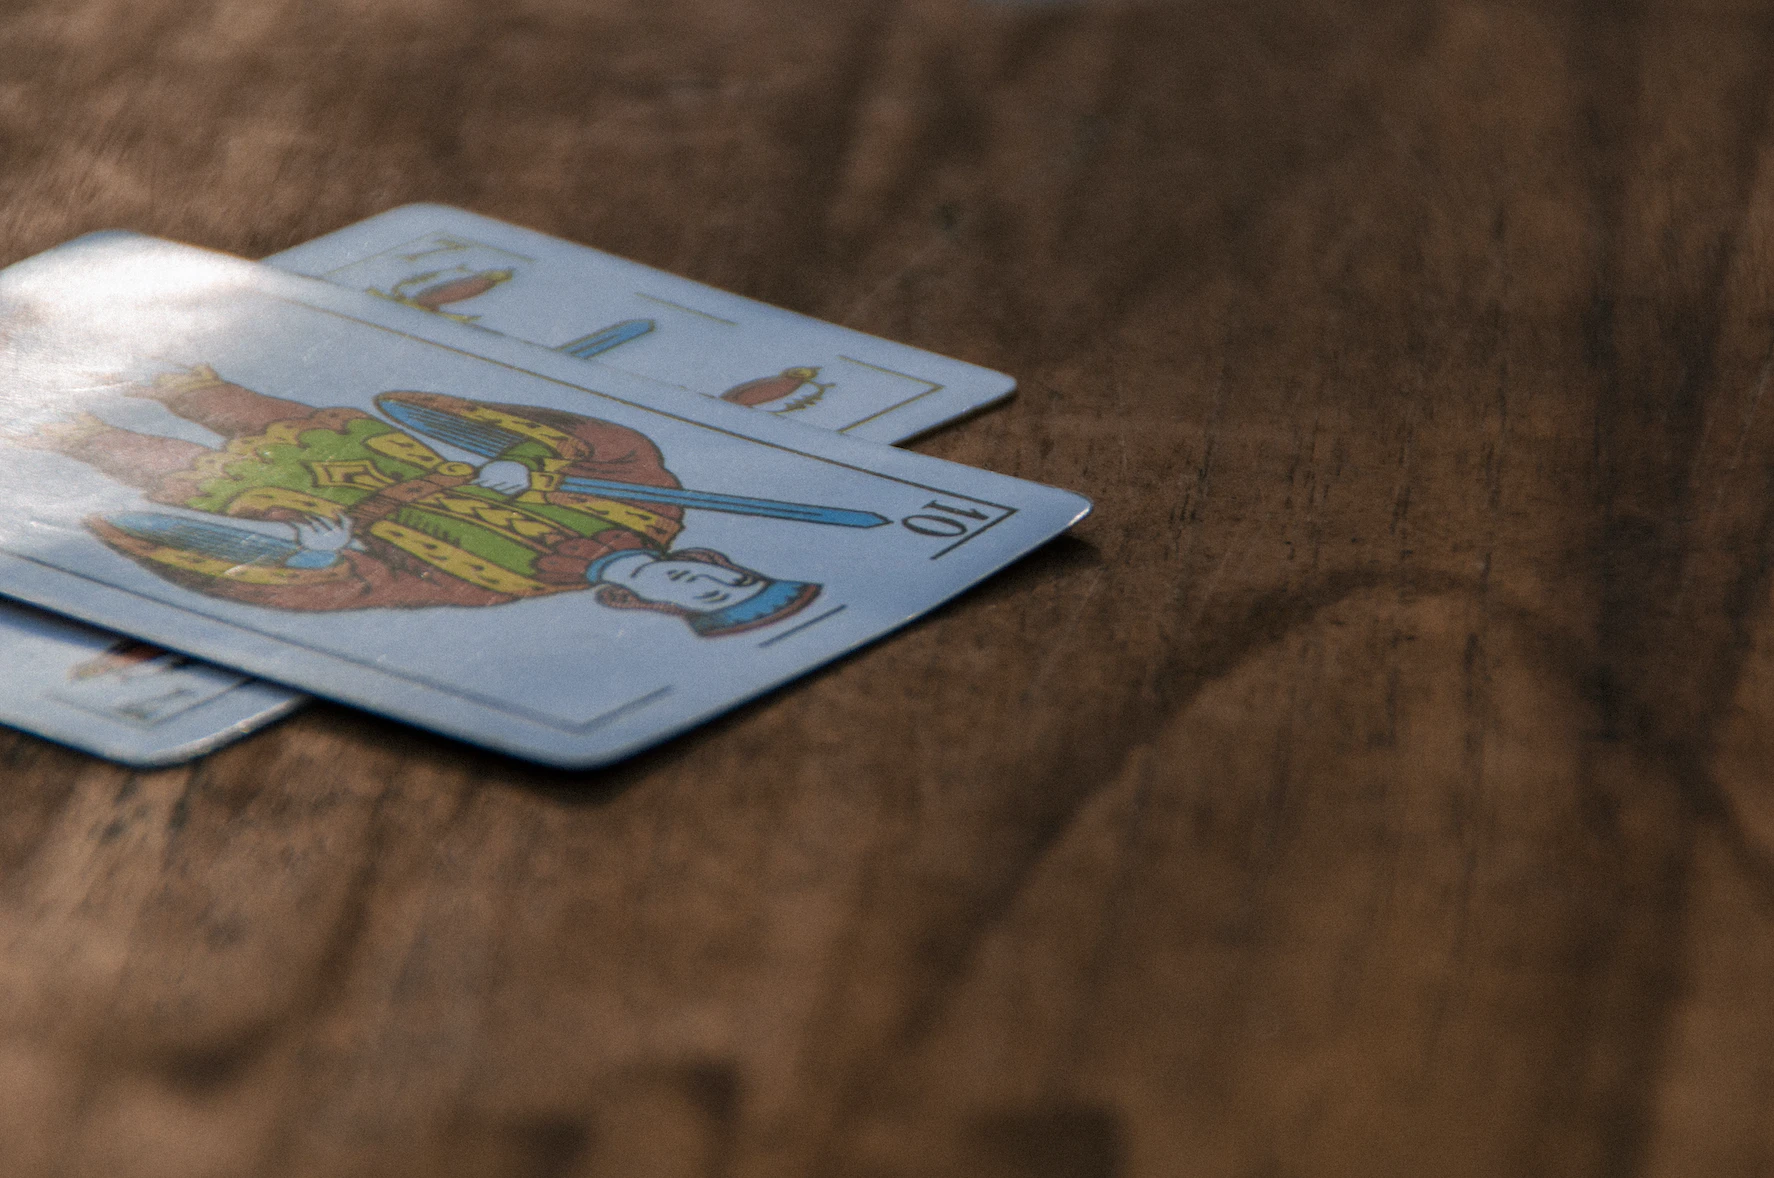
Truco is probably the most iconic card game in Uruguay. While it’s always associated with gaucho culture, to find its origin, one must go back several centuries and thousands of kilometers away from the Río de la Plata because it is estimated that its origins date back to the 15th century and the Arabs were its creators. Later, the Spanish adopted the game, and then it was taken to ports in the Viceroyalty of the Río de la Plata. Initially, it was adopted by people in the countryside, but it gradually spread within cities, becoming a classic game in bars and general stores.
From south to north and from east to west
After seeing the long journey of Truco from its origins to our lands, it should not surprise us that the card game is played in many other countries. Truco is not only played in Uruguay or Argentina, but it has also been adopted by people in other Latin American countries such as Venezuela or Paraguay. Even across the ocean, in regions of Spain or Italy, one can find the game among the popular knowledge. Although Truco is known and played in various corners of the world, each country has developed its own version by adapting, modifying, or even adding some rules.
Between chance and deceit
The main complexity of Truco worldwide lies in the need to deceive the opponent and avoid being deceived. However, Uruguayan Truco presents certain variations, mainly the use of a “Muestra,” which makes it more complex and dynamic compared to variations played in other countries, while increasing the influence of chance in the game. Therefore, while Truco itself is not Uruguayan, the way we play it here is unique to Uruguay.
The impossibility of crunching the numbers
Most Uruguayans have played Truco at some point, declared a “flor” (highest scoring hand) at least once, and perhaps even lost an “envido” with a score of 36. However, almost no one knows the probability behind these events that can bring us great joy or bitter disappointments. Someone who is beginning to study probability and statistics, armed with counting and combinatorial techniques, might venture to calculate these probabilities that shuffle with every card dealt, invisible to most eyes. However, they will quickly realize that this task, while possible, is too arduous and prone to error, especially when asking more specific questions.
Let’s play millions of times
This is where the approach we will address in this blog comes in. This approach involves simulating millions or even billions of Truco hands using a computer. In this manner, if I want to know the probability of having a “flor,” I simply have to see how many hands had a flor among the total simulated hands and compare it with any other questions we have. We just have to program the simulations and then count what we want. The only catch is that the results obtained will be approximations of these probabilities. For these approximations to be good, enough simulations need to be performed to cover the rarity of what we are counting.
Is having a flor a rare event?
With the introduction behind us, let’s start answering questions that everyone might have pondered at some point. First, let’s see how probable it is to have a flor in any hand. The chance of having a flor is… 15.46%
How many “pieces” (cards with points) should one expect?
Another aspect we can explore is how likely it is to have one, two, three, or possibly no pieces.
None: 65.43%
One piece: 30.78%
Two pieces: 3.68%
Three pieces: 0.11%
Conditional probabilities
Up to this point, we’ve seen the chances of having a flor and the chances of having pieces. One thing we could do is to observe the probability of these events conditioned on each other. That is, changing the questions to: “How likely is it to have a piece given that you have a flor?” or “What are the chances of having a flor if you have a piece?”
The first question is usually noted as P(Piece | Flor), while the second is denoted as P(Flor | Piece). With this concept clarified, let’s answer the questions in the same order we posed them.
Without Flor
None: 72.71%
One piece: 27.29%
With Flor
None: 25.61%
One piece: 49.86%
Two pieces: 23.80%
Three pieces: 0.73%
Notice how when you have a flor, the chances of having pieces increase compared to the general chances we saw earlier, while when we don’t have a flor, the chances of not having pieces rise. It’s important to note:
P(0 Pieces | No Flor) + P(1 Piece | No Flor) = 100%
and also:
P(0 Pieces | Flor) + P(1 Piece | Flor) + P(2 Pieces | Flor) + P(3 Pieces | Flor) = 100%
In other words, if we add the chances of all possible events given the conditioning, we obtain completeness, which makes sense.
Now let’s answer the other question, reversing the order of what we just analyzed.
No pieces
Without Flor: 93.93%
With Flor: 6.07%
One piece
Without Flor: 75.01%
With Flor: 24.99%
We omit the cases of 2 and 3 pieces because in those cases, there is always a flor. While performing simulations costs only a few seconds, we might save some simulations by using the already available probabilities to calculate new ones. For this purpose, Bayes’ famous formula is very useful, allowing us to reverse the conditionals. In our case, we could have used it to save the last simulation. For example, let’s see how we arrived at approximately 25% for P(Flor | 1 Piece) from the simulation, but we could have achieved the same using Bayes as follows:
P(Flor | 1 Piece) = P(1 Piece | Flor) × P(Flor) / P(1 Piece)
All these values were previously calculated, as the first term was one of the first conditionals, and the last two emerge from the general probabilities we calculated at the beginning. So, it’s not necessary to experimentally obtain both conditionals; it’s sufficient to obtain one and then rely on the general probabilities to derive the other.
What are the chances of winning an “envido”?
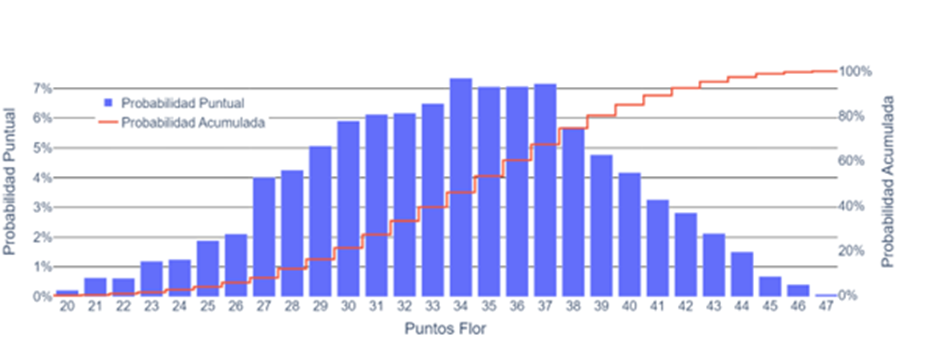
Leaving the mathematical aspect behind and promising not to delve deeper into those matters, let’s continue our analysis. Let’s now see which envido scores are most probable by examining the following graph.
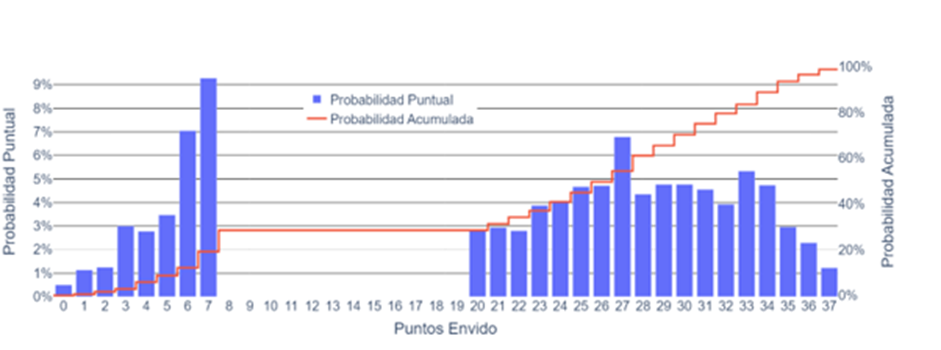
In the graph, the blue shows the probability of obtaining a specific score, while the red indicates the probability of having a score lower than it (the so-called cumulative, which we can use to estimate our chances of winning).
From this figure, we observe interesting things: it’s less probable to have 0 points (the minimum) than 37 (the maximum); the most probable score is 7 points, followed by 6; or that having more than 20, the most probable scores are 27, followed by 33.
Regarding the cumulative, we notice that half of the envidos are lower than 26, and only 10% of envidos are less than 6 points.
What if I know my opponent has a “piece” (card with points)?
Just as we calculated the envido probabilities, as we did before, we can condition them to have or not have a piece. Without further ado, let’s see the results of the simulations.
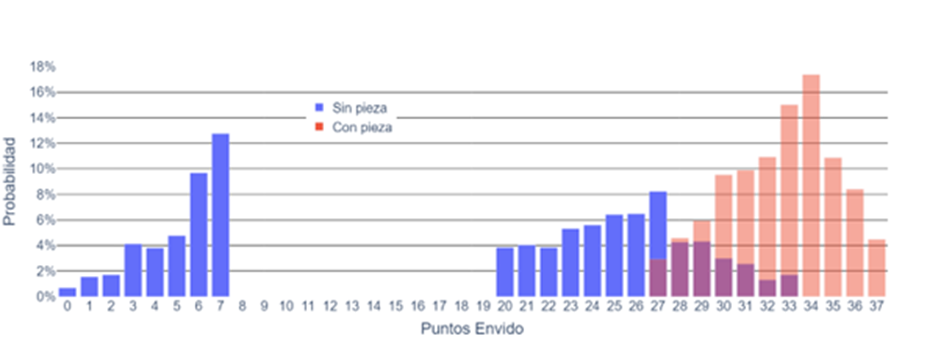
First, we confirm what we expected: if we don’t have a piece, the scores are capped at 33, while with one piece, they bottom out at 27. (We did not analyze with more than one piece because in such cases, we would have a flor, requiring another analysis).
Other things we can observe include that, for example, if we have one piece, the most probable score is 34, and without a piece, it’s 7, just like in the general case.
Will they or won’t they have a piece?
If the opponent has an envido score between 27 and 33, they may or may not have a piece. This question, which we don’t pose directly, is essentially reversing the conditional, asking, given the score, what are the chances of having a piece?
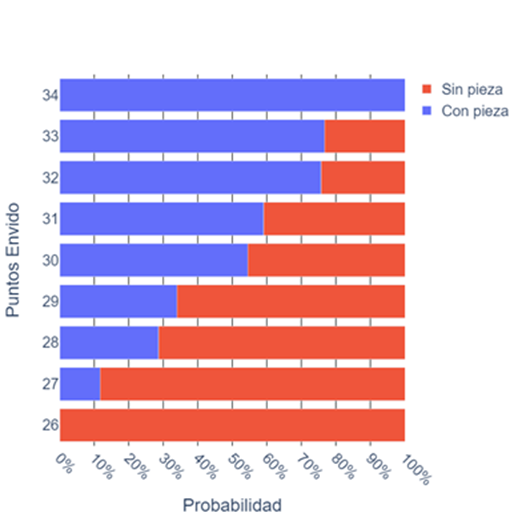
We can draw other conclusions now. For instance, if they have 27, there’s only an 11.74% chance of having a piece, but if they have 33, there’s a probability greater than 75% of having a piece.
The same but with the “flores” (card combinations that are valuable)
Just as we did for the envido scores, we can replicate the analysis for the points of the “flores,” as shown below.
With the flower scores, we notice a more uniform behavior, with no particular value being significantly more probable than the rest, and high values being as probable as low values. However, if we had to draw a conclusion, it would be that half of the flores have less than 35 points.
Now, segmenting the flores by the number of pieces
Again, we can condition the distributions of the flower points based on the number of pieces. This becomes more interesting because a flower can have from zero to three pieces, and each alternative has its own distribution of points, as shown in the following graph.
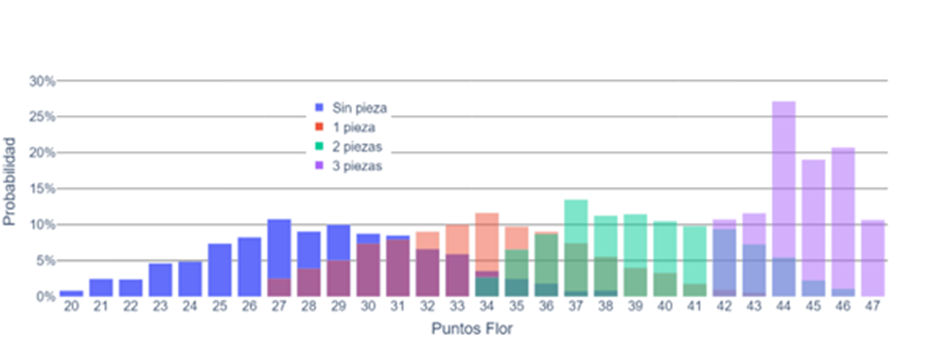
Now we see that without pieces, the most probable value is 27 points; with one piece, it’s 34 points; with two pieces, it’s 37, and with three pieces, it’s 44. We also notice that the fewer pieces we have, the wider and less rich the range of possible values for our flower is.
How many pieces will they have?
As we previously discussed, there are flower values where the possibility exists to have anywhere from no pieces to two pieces or from one to three pieces. This allows for an inverse analysis, obtaining the probabilities of having a certain number of pieces based on the value of the flower.
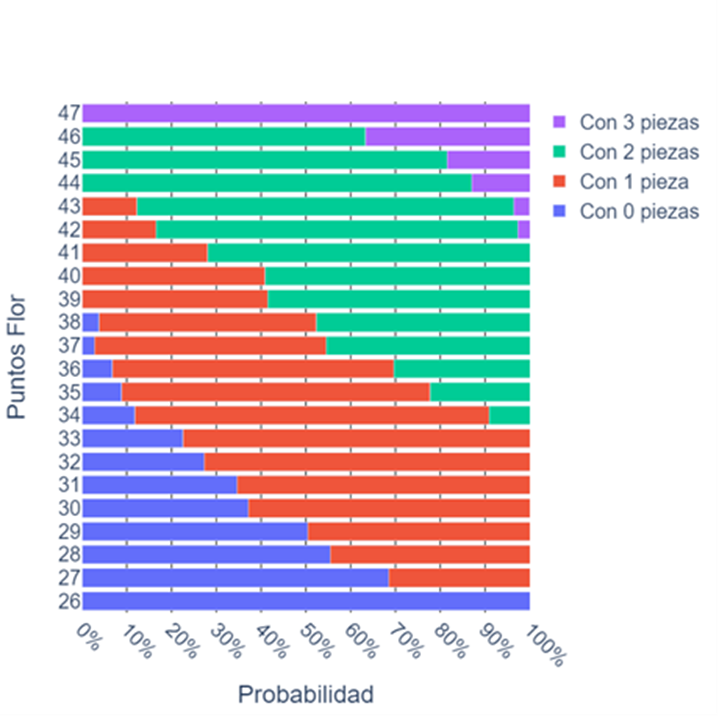
What we’ve just discussed is shown in the graph, indicating, for example, that if the flower has 42 points, it could well have one piece (less probable), two pieces (which would be most likely), or even three pieces (which would be quite rare but not impossible). It also helps confirm things, such as if they have less than 27, they definitely have no pieces, or if they have more than 38, they definitely have two or more pieces.
Conclusions, what was missing, and a little falsehood
Throughout the blog, we could confirm how useful simulations are in calculating probabilities in this type of game, where many variables need to be considered, making exact calculation through counting challenging or, at least in my opinion, unmanageable. This tool was attempted to be used to address the main questions that all of us who play Truco have had at some point, although it’s obvious that some aspects were beyond the scope of this analysis.
Something we didn’t analyze to avoid extending it too much is what happens when we analyze several players at once. Throughout the blog, we always analyzed the chances of ME having a certain thing, given that I have some other thing. Therefore, a future analysis could focus on what happens when we look at multiple players at once and condition them individually or as teams.
For example, we’ve already answered the chance of a player having a flor, but we could ask, “What are the chances of, in a one-on-one game, at least one player having a flor?” “And in a two-on-two game or a three-on-three game?” We could also ask, “What are the chances of, in a two-on-two game, there being a crossed flor?” “How rare would it be for all four players to have a flor at the same time?” Among many other questions.
To conclude and to reinforce the need for an analysis considering more participants playing at once, let’s address something we mentioned in the blog that wasn’t entirely true.
At one point, when discussing the envido scores, we mentioned that we could use the cumulative to calculate our winning chances. However, this isn’t entirely accurate because for this to be true, it should be that my opponent’s hand is independent of mine. And this clearly isn’t true because, for example, if I have 37 in the envido, it’s evident that my opponent cannot have 37, because I already have the 2 of the “muestra”; or in general, if I have a piece, it’s less likely for my opponent to have one.
For high values of my envido, it’s a mistake to assume that my rival’s scores are independent of mine, although for intermediate values, it’s a good approximation, and that’s why we left it in the analysis.