
Birds of a feather vote together (part III)
Last week, “aquienvoto.uy” [whoIvote.uy], became a media boom, everybody was talking about. It is an application which recommends users who to vote, in the upcoming elections.
Users, basically, must score from 1 to 5 (1 meaning ‘disagree’, 3 ‘neutral/don’t know’ and 5 ‘totally agree’) to 26 statements on economy, security and social affairs. Next, based on their answers, they are told who to vote.
In the first part of this article I used an example to explain how the algorithm works. In the second part, I analysed users’ answers to find out which party and candidate had most “votes”. Also, according to the options chosen, I could tell which statements most Uruguayans either agreed or disagreed upon, and which ones were most controversial.
In this third and last part, (in addition to going deeper into users ‘answers) I will show my own classification models, which I developed based on algorithms other than KneighborsClassifier.
Mi own model
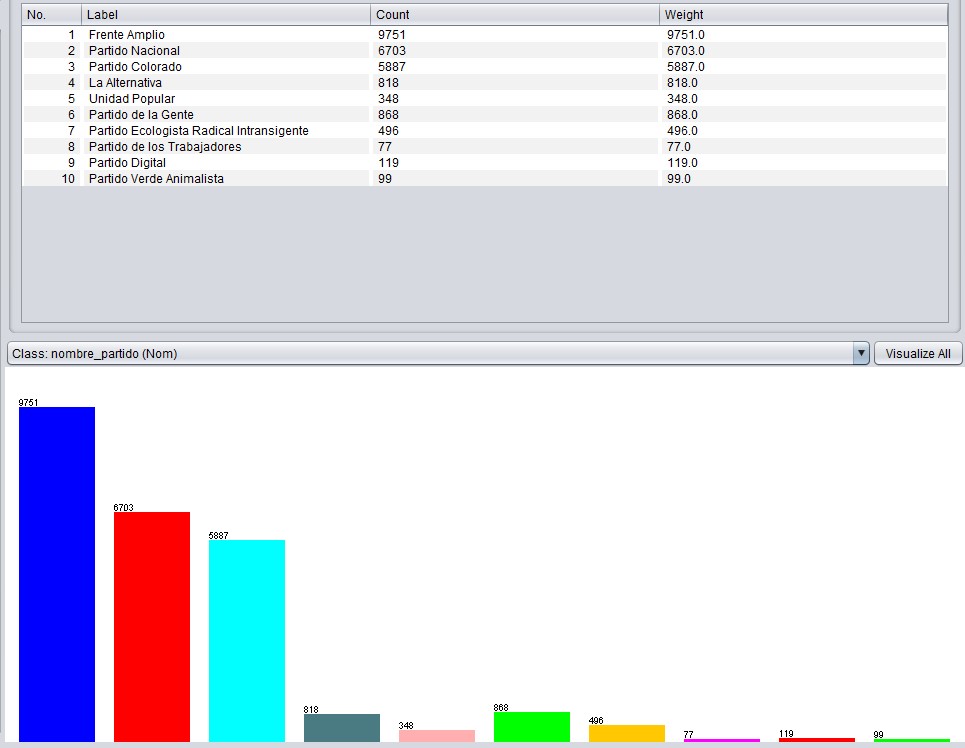
It dawned on me to create a new model, a decision tree, considering the data of the 25.166 people who had answered the last question on who their preferred candidate was. I decided to use Weka.
After having imported data, their primary trend reveals interesting information:
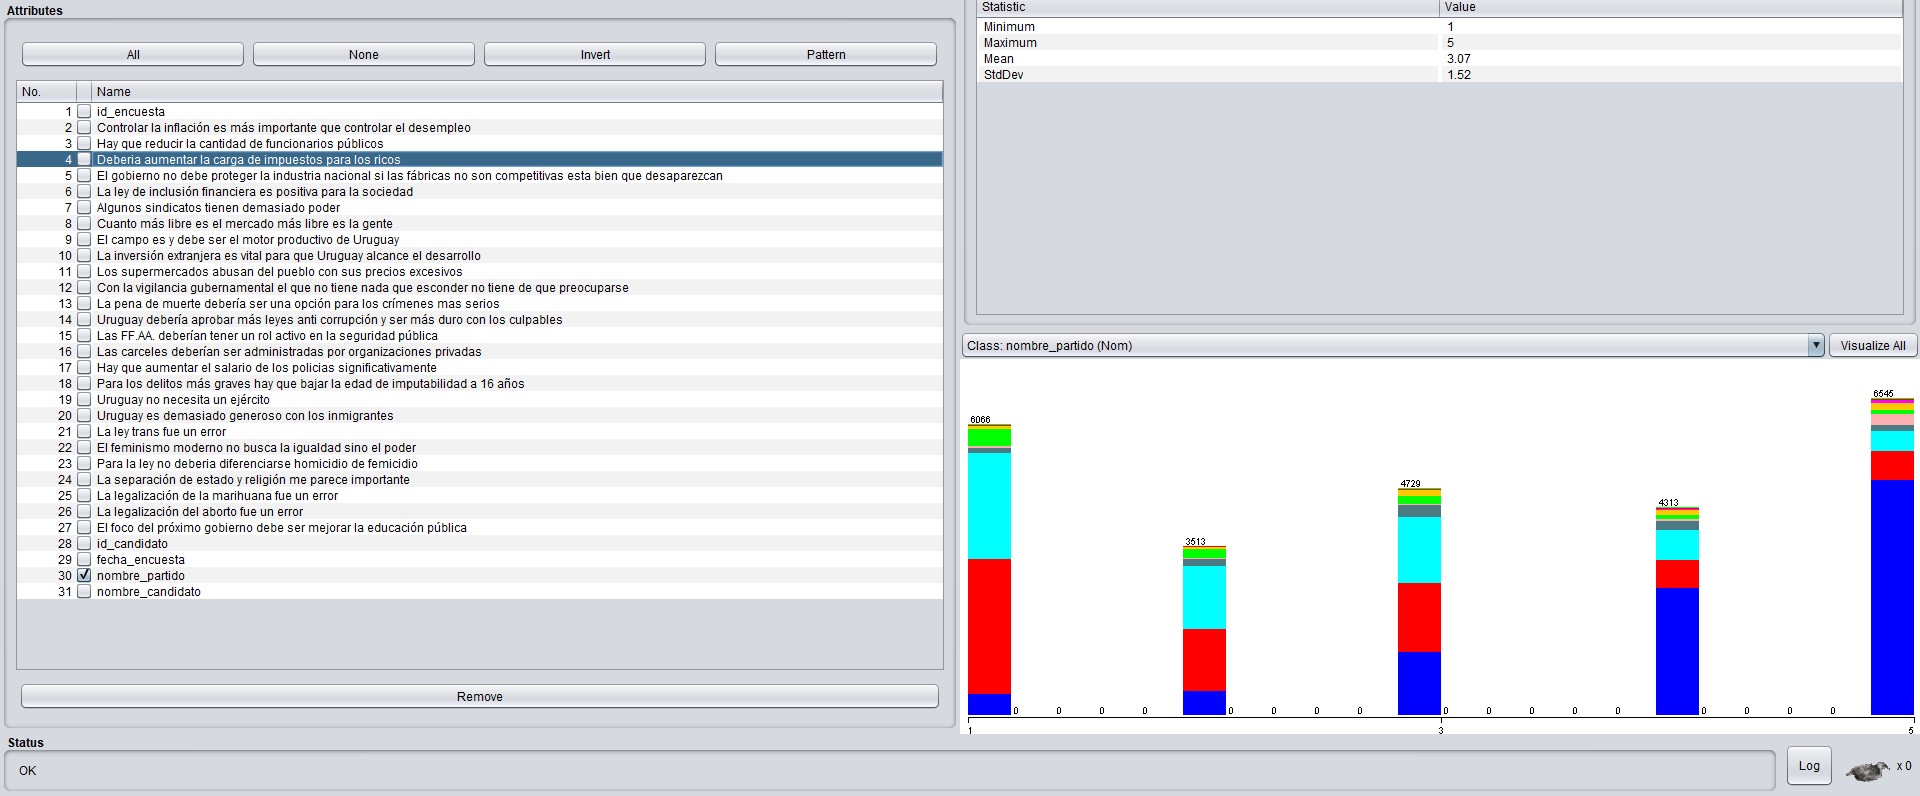
We can see that if we select the attribute “should increase taxes on the rich”, the bar corresponding to “fully agree” (5) is almost all blue, who are the people who had marked they were Broad Front [Frente Amplio] voters, whereas the “disagree” bar is predominantly red and sky blue, meaning voters of the Red and National parties, [Colorado and Nacional] respectively.
The opposite happens with answers to “Legalizing marihuana was a mistake”
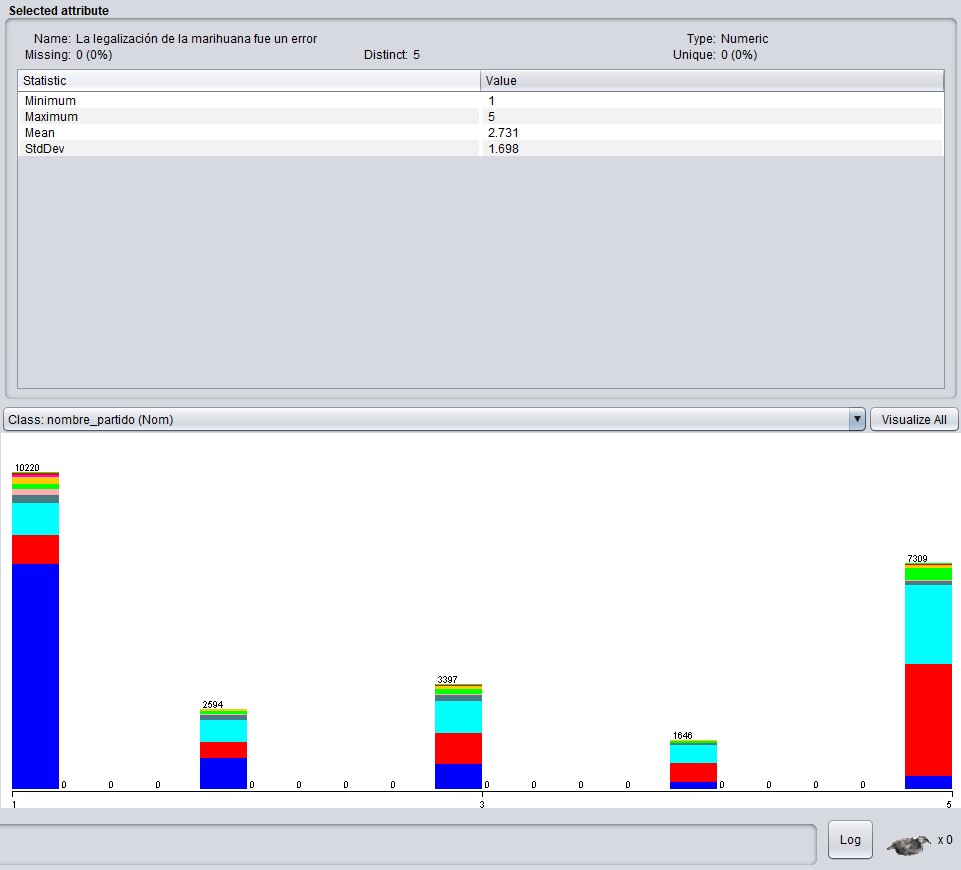
Most broad-fronters agree with legalization, whereas most disagreement is from whites and reds.
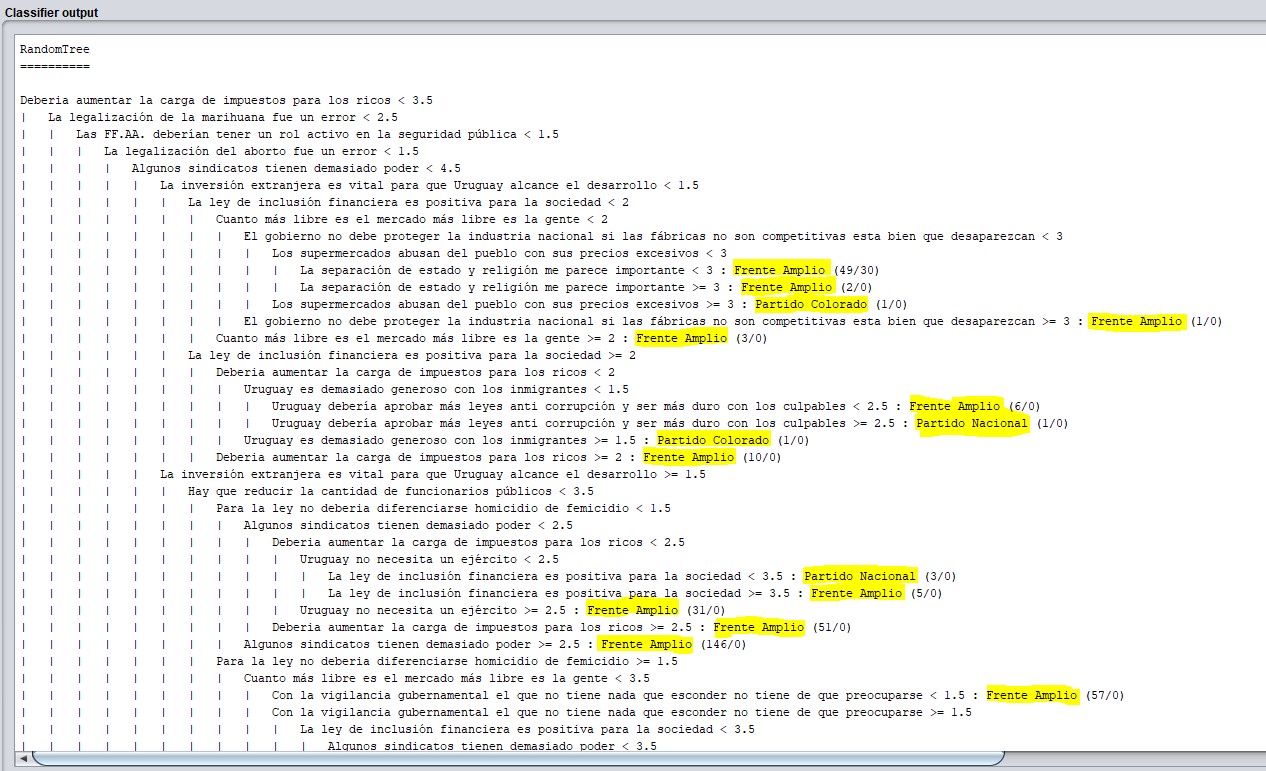
Now let’s get down to our business, and have a look at the decision tree, where I applied an algorithm called Random Forest.
To test the model, I took a random sample of 30% of the registries from the data-base. To make it easier I filtered some registers and kept only those where people had declared to be voters of the Broad Front, National Party or Red Party.
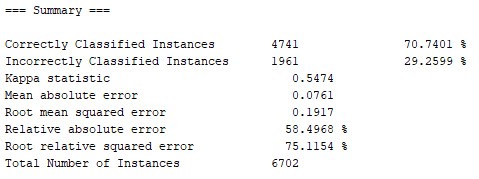
Here we can see that out of 6.702 surveys that were used to test the model, almost 71% had been correctly classified (with 100 iterations for the creation of the model).
In the confusion matrix we can see what the false positive and negative were like:
In this matrix you should read that the following people were classified as broadfronters: 2.655 broadfronters, 174 whites and 208 reds. However, among the users who had indicated they voted for the Broad Front, 2.655 were correctly classified, 148 were classified as whites and 104 as reds.
In the following image we can see part of the generated tree:
Then I wondered, what about creating yet another model, based on rules with Jrip algorithm? Here you have a couple of rules that the algorithm unveiled, and which were very interesting to me:
If: (The number of public officers has to be reduced = 5) AND (Supermarkets take advantage of the people with their extremely high prices⇐3) AND (Next government’s focus should be on public education improvement = 5) AND (Legalizing abortion was a mistake <= 4) AND (Legalizing marihuana was a mistake >= 2) AND (Uruguay is too generous with immigrants <= 2) ⇒ this person votes for the Red Party
On the other hand, If: (Trans law was a mistake >= 3) AND (The Army should play a more active role in public security >= 4) AND (Cattle raising and agriculture are and must be the productive core of Uruguay = 5) ⇒ this person votes for the National Party.
Conclusions
Again, there are fun and innovative applications of machine learning. I am very grateful to @johnblancott for the inspiration, and particularly, for sharing the answers’ data so I could carry out my own analysis.
Héctor Cotelo @CoteloHector
Data Analytics & Information consultant