
Birds of a feather vote together (part I)
From night to day, a new “test” called aquienvoto.uy [whoIvote.uy], became a media boom everybody was talking about. It is an application which recommends users who to vote in the upcoming elections.
This is how it works: users rank 26 statements on economy, security and social affairs, from 1 to 5 (1 meaning ‘disagree’, 3 ‘neutral/don’t know’ and 5 ‘totally agree’). According to their answers they are told who to vote.
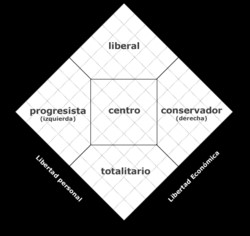
I had been told it was based on “automated learning”. But I didn’t believe it. At first I thought it was a new version of the political test www.testpolitico.com which, after a user has answered a questionnaire, they are told where they are located in Nolan’s Diagram. I believed that after having featured all candidates, the system could easily show us which one was closer. In such case, the application would not have required Machine Learning, Artificial Intelligence or anything like it.
For me, that was it, until I realized the application had become viral and that it was being critized in social networks, and everybody was talking about it. Some style issues:
- You always get Talvi for an answer.
- It is not transparent: we do not know who is behind all this, or what their intentions are, how the algorithm was configured, how many people have answered, if it is biased, etc.
- It is unreliable, nobody can consistently give a 1 or a 5 to everything, still, the algorithm delivers names.
- The survey was requested by the heads of @dmartinez_uy’s campaign to steal data .
- Attorney Salle Lorier was not included.
- It’s quite poor at learningIt is more about statistics than anything else. There was no training before launching.
- It’s hackeable, with bots you can make the system learn that whatever the answers are, it will always deliver the candidate creators want.
- Same happened with Facebook & Cambridge Analytics (?).
- Is it antidemocratic (?).
It was being critized so much, that I felt sympathy because recalled when I had been put down when I published the result of social networks’ analysis which showed that Cebolla Rodríguez was the most influential player of the National Football Squad or when I carried out a research on what running candidates in Uruguay write on Twitter . So, I decided to look into it.
I visited the site to learn more about it, and there I saw that the person in charge of the project is Juan Pablo Blanco (@johnblancott), whom I don’t know, but I am already following him, together with two more friends. It is an open project, therefore, its code, system’s training set and users’ answers are published in his GitHub.
Here, you can also see how the project was developed.
After going through this information, I realized I was wrong: it was not a new version of the political test, but a solution truly based on ML. It became irresistible for me, then, so I decided to delve more into it, particularly because its code and data were available!!!
This explains why I decided to write this article, which will be published in three parts: the first one will explain how the program works, the second one will analize users’ answers, and the third one will show my own classification models, with different algorithms.
How does the program work?
I will do my best to explain in plain language how this kind of programmes work like.
To begin with, the candidates themselves did not answer the questionnaire. The program does not inform you whose candidate’s beliefs are closer to yours, but what candidate people who think like you vote for.
The program is based on an algorithm known as “KNeighborsClassifier”. It is basically an object classification algorithm given an initial dataset, it attempts to correctly classify any new input. The initial data consists of several descriptive attributes (the answers to the questions) and a single objective attribute (a candidate).
Its developers began with 177 participants who were asked to respond to the ideological statements form, and who they were voting for in the upcoming elections. From that initial dataset, the program is able to learn how to classify new input.
How? Usually, to create a model, the initial dataset is split into two random parts: one that is used to train the model, and another one that is used to validate the created model and see how accurately it works.
Clearly, if the model is trained with erroneous answers (so to speak), its learning will be innacurate and, consequently, it will deliver incorrect answers. But the good news is that the more it is used (provided users indicate who their candidate is at the end of the questionnaire) the more accurate the model becomes.
Back to the algorithm operation, the model created is basically an environment of n-dimensional vectors, where previous responses have already been classified. Therefore, when a new user completes the form, it is represented again as a vector in that environment; next, the algorithm selects the closer neighboring K (vectors), according to a similarity metric previously defined. Then, according to how most of those neighboring K vectors have been classified, the most frequent classification is assigned to the new user.
Consequently, the determined number of neighbors is crucial (the famous K value), as is the similarity metric used. Variations in these decisive aspects can cause the model deliver different results.
Let’s see the influence of the K value. We are going to create a questionnaire with 2 questions to make it easier, and be clearly visualized on the screen. Suppose that in the first question I answered 2 and in the second question I answered 4.
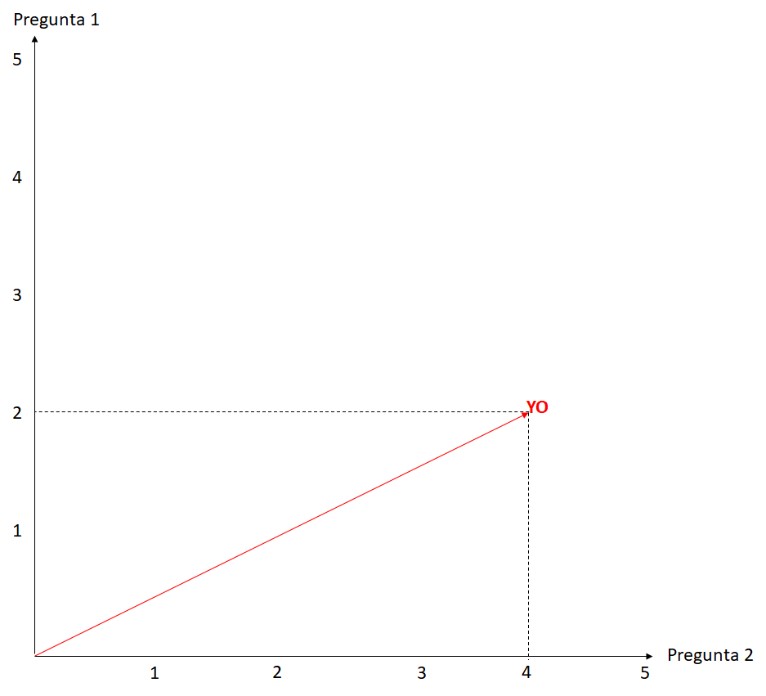
Next, let’s add this to the set of previous answers, which have already been classified:
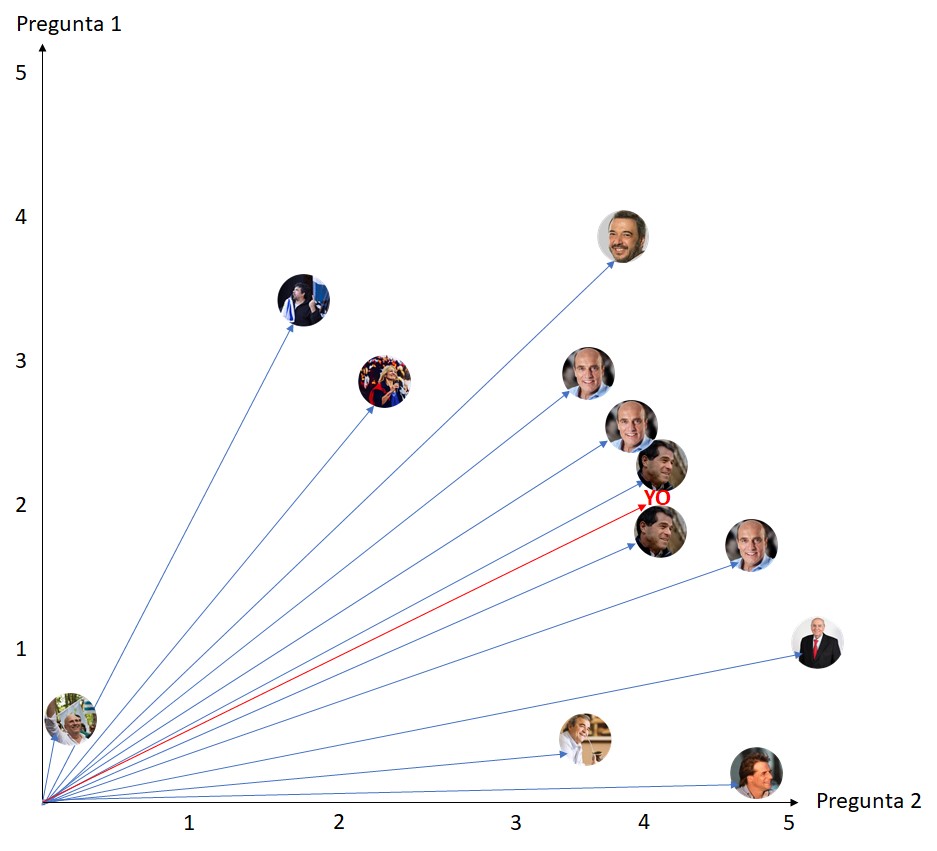
What would happen if we took the two closest neighbors?
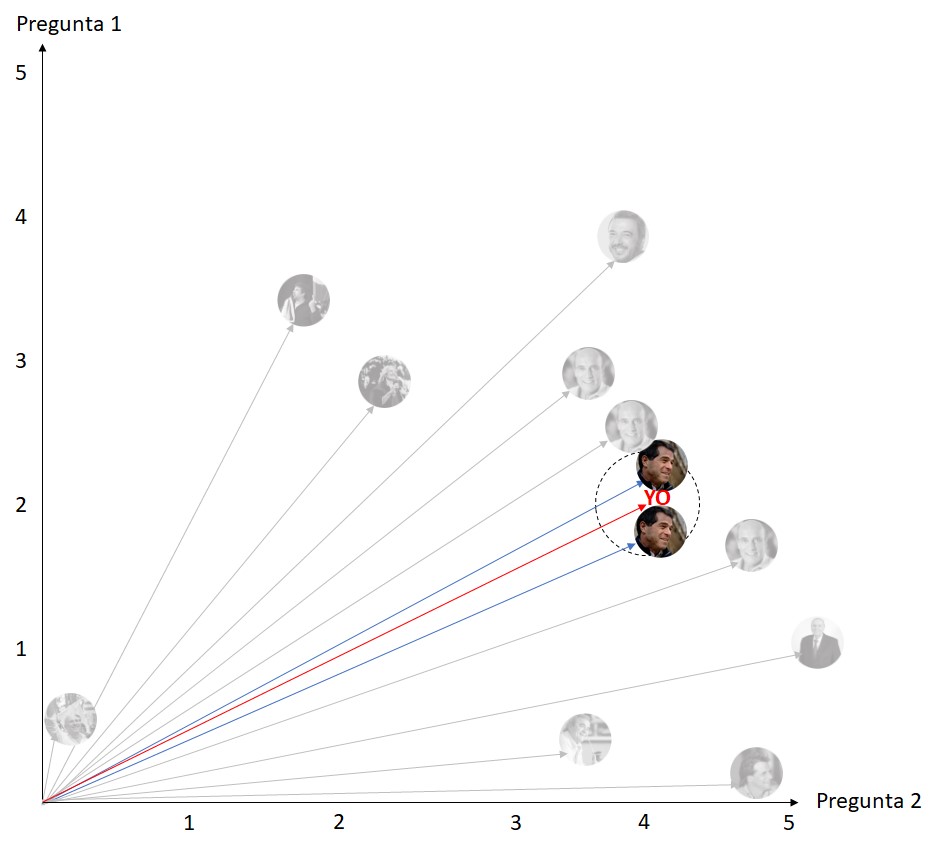
Considering only the two closest neighbors, the algorithm would deliver that my candidate is Ernesto Talvi. See what happens if we take the four closest neighbors:
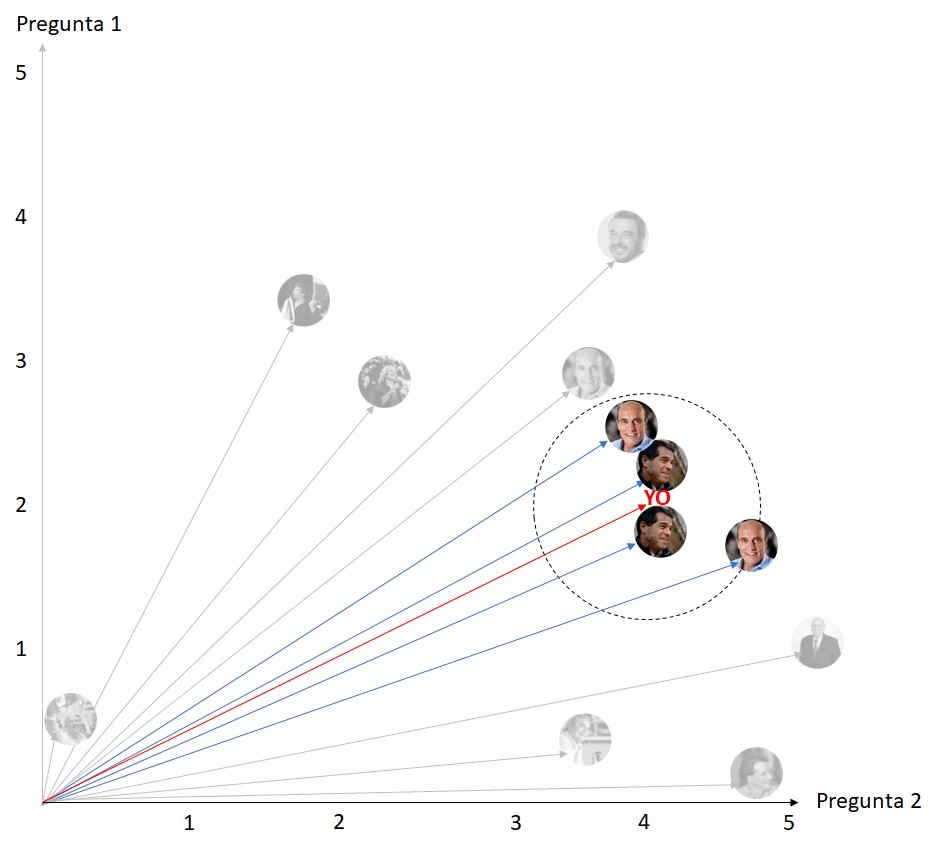
Taking the 4 closest neighbors, the system could not make a recommendation, because among those 4, there are two which are classified for TALVI and 2 for Daniel Martinez. And if we took 6 neighbors?
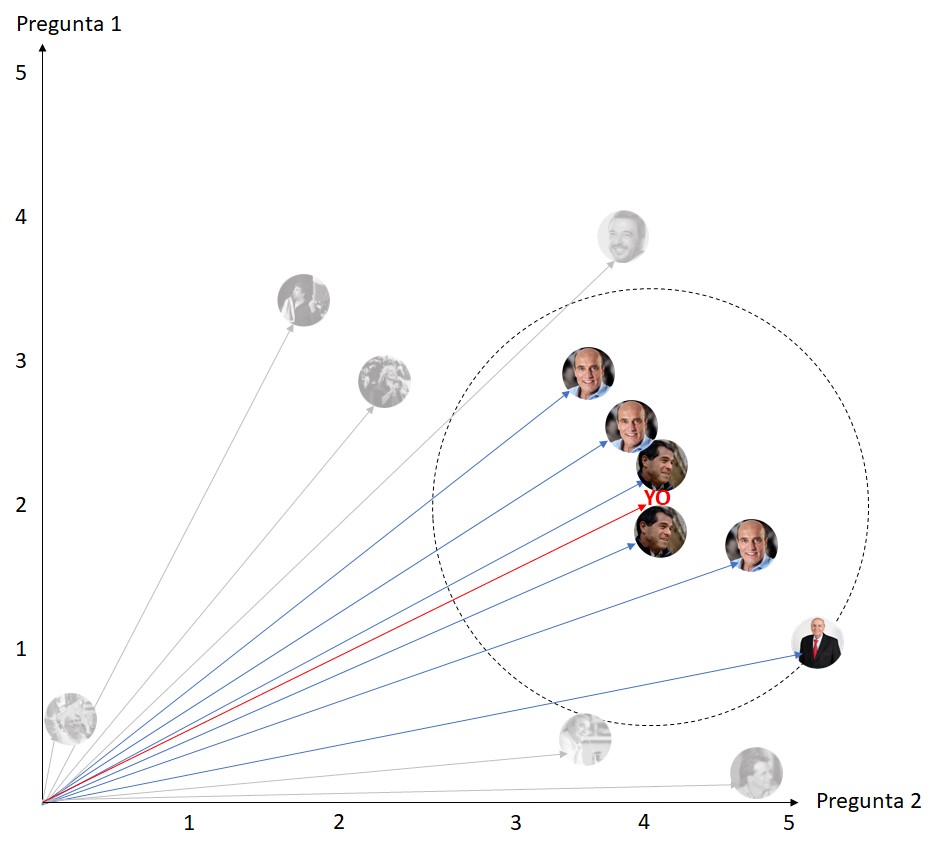
Then the system would indicate that my candidate is Daniel Martinez, because among the previous 6 responses closest to mine, there are 3 Martinez, 2 Talvis and 1 Julio María Sanguinetti.
In the following parts of this article, I will analyze users’ answers to see what we agree on, and what is most controversial among Uruguayans. Additionally, I will develop alternative models other than the KNeighborsClassifier.
Héctor Cotelo @CoteloHector
Data Analytics & Information consultant