

What do Uruguay’s running presidential candidates’ tweet? Part II
In the previous post, I analysed candidates’ tweets by processing natural language. Here, we will analyze their networks.
Network Analysis
I thought it was relevant to find out who candidates follow in Tweeter. To this end, I extracted the data of the people that each candidate follows, and drew the following graph:
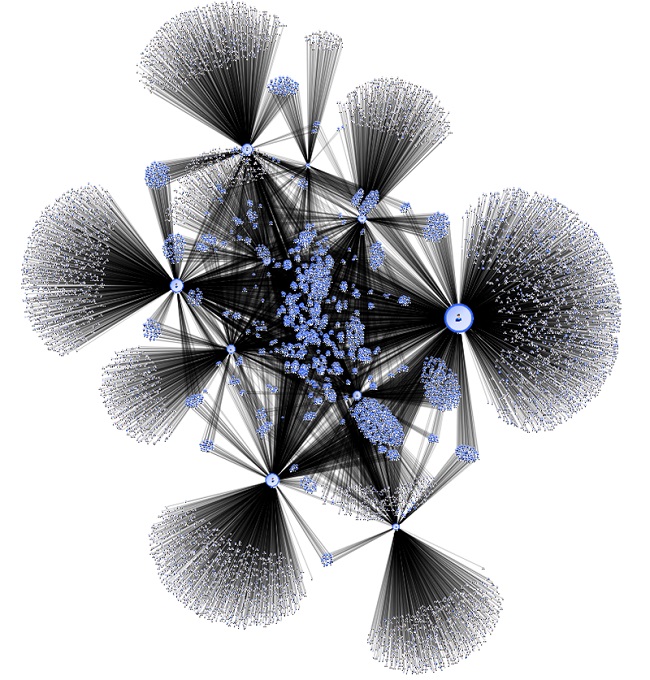
Entangled but interesting. However, we can use the following centralization assessment analysis to find the most important actors of this network.
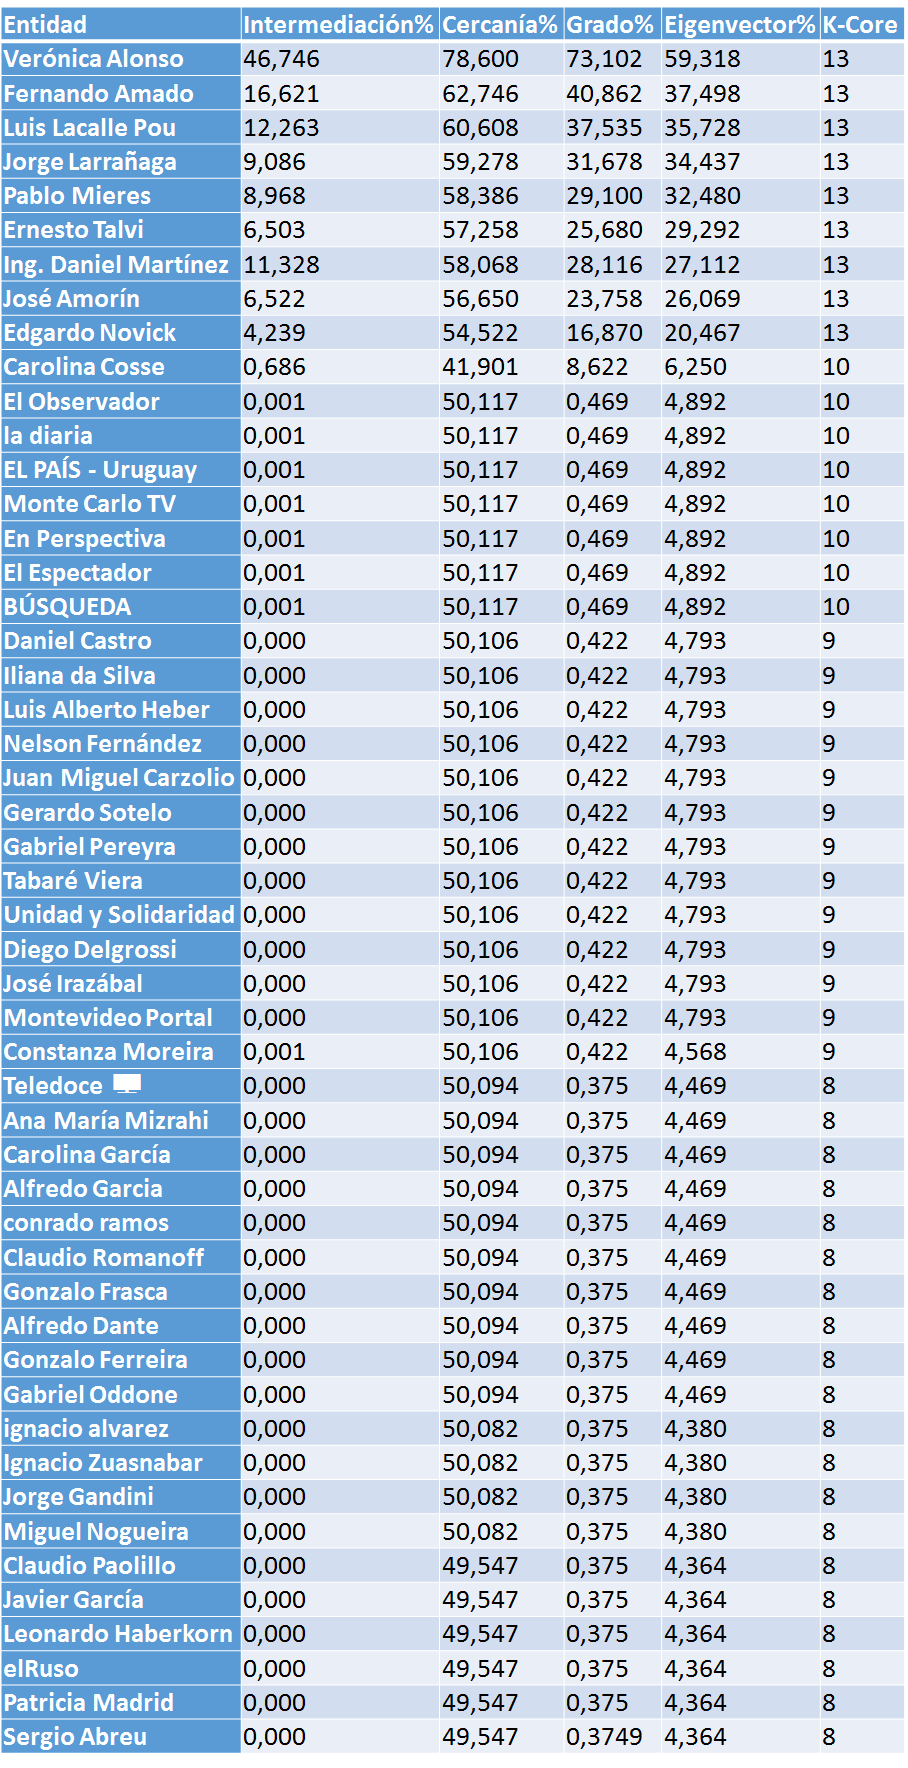
I used 4 assessment concepts: degree, closeness, intermediation, and their own vector (or eigenvector).
• Degree: the simplest, but the most representative at the same time. It shows the number of links each node has. Closeness adds up the shortest distances from one node to the other nodes in the net. In other words, how many times someone has to “jump” to go from one person to another. Intermediation is the number of times a node is the shortest “bridge” between two nodes.
• Own vector (or eigenvector) measures a node’s influence in a network. Relative scores are assigned to nodes in the network, based on the concept that connections to high-scoring nodes are more relevant, than equal connections to low-scoring nodes. A high own vector score means that a node is connected to many high score nodes.
The top 50 actors in the network are:
You scratch my back and I’ll scratch yours…
This network analysis has considered only the candidates, which resulted in the following closeness matrix:
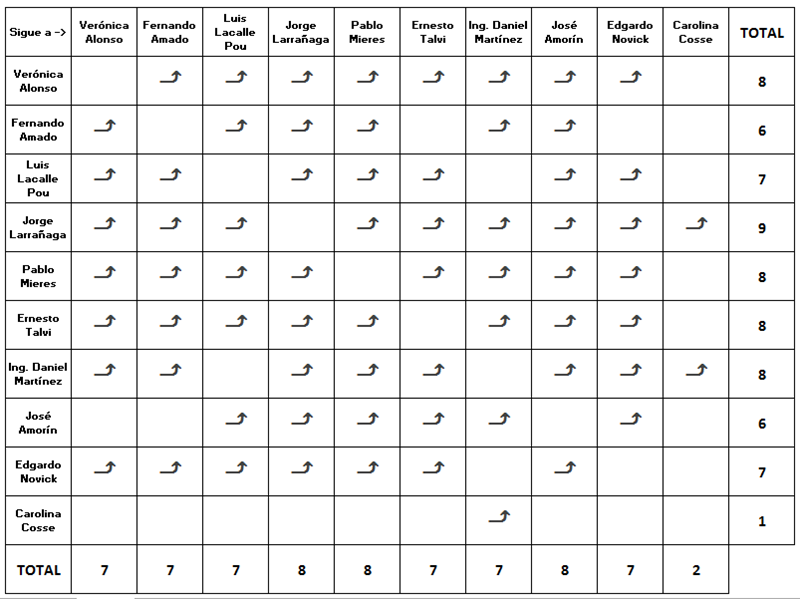
The most loving is Larrañaga (since he follows everyone), and the hardest hearted is Cosse: she follows only one. On the other hand, the most popular candidates (whom their peers follow most) are Larrañaga, Mieres and Amorín with 8 followers each, and Cosse is the most unpopular.
According to the matrix, some candidates follow each other, mutually. In the following graph, links mean that they mutually follow each other.
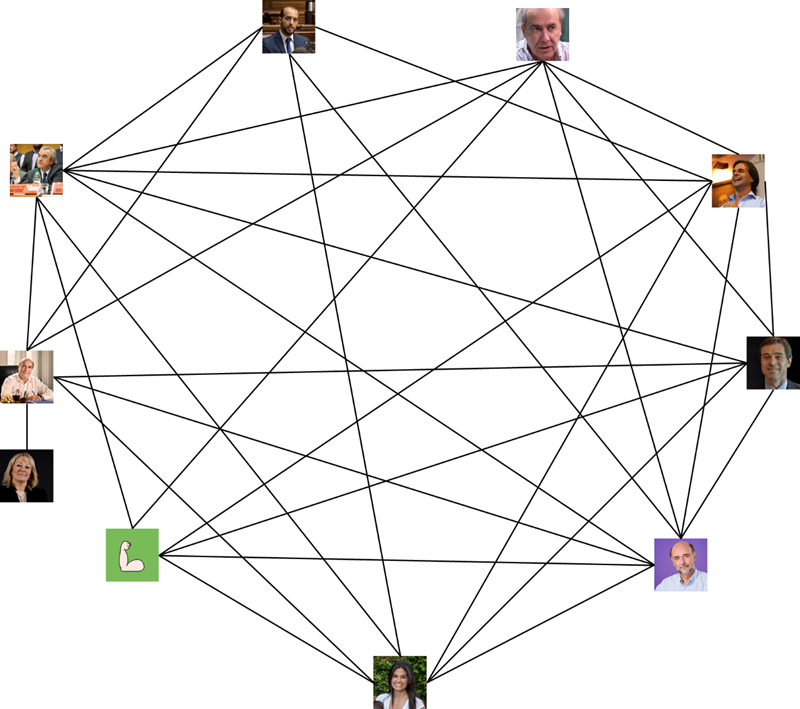
At first sight (even though we only show the links between mutually following candidates), the graph is very thick, which should be interpreted as a positive feature. I believe it is relevant for candidates to be up to date with what everyone else thinks. Eventually, in Parliament, they will be together and discuss.
Numbers represent the density of a graph; it is calculated by dividing the actual number of links by the number of potential links. In a graph with 10 entities, the number of potential links are 90. Out of those 90, there are 68, which represents almost 76% of the total. If Cosse is not considered because she is the least connected, the ratio rises to 90%.
Who do you like most, him, or me?
Another driven graph can be drawn (with driven links) to show cases in which one candidate follows another, but the latter does not follow the first one.
We see for example that Martinez follows Novick, but Novick does not follow him. However, Novick and Talvi follow Amado, but Amado does not follow either of them. Politics is plagued with unrequited loves.
Everything comes to an end
We are better equipped and informed when we carry out information analysis available on social networks and the Internet. This information is often referred to as “dark data” and are rarely resorted to as compared to data that is usually stored in internal databases.
It is estimated that there are companies which have dark data stored, but which fail to analyse a minimum of 1%. Fortunately, this is changing, and companies are applying social media listening techniques to be updated on what is going on in the nets.
I would like to express my gratitude to Daniela Vázquez for inspiring me to write this article, after she wrote a post about what members of parliament talk about during their sessions.
Methodology
First and foremost, gathering data. To this end I tried to use Twitter API provided, but the problem I met was that standard API is limited by access token. Basically, you can make a limited number of requests in a 15-minute window, so gathering all the information I needed would have taken ages.
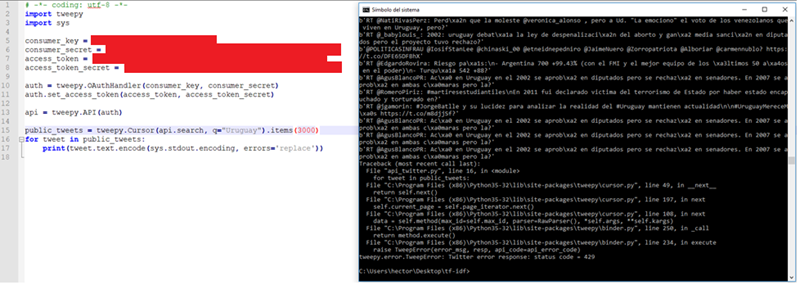
Error code 429 means that API’s speed limit has been reached. I then realized that there are APIs , beyond the standard (also free in some cases), which also have limit, so I decided otherwise.
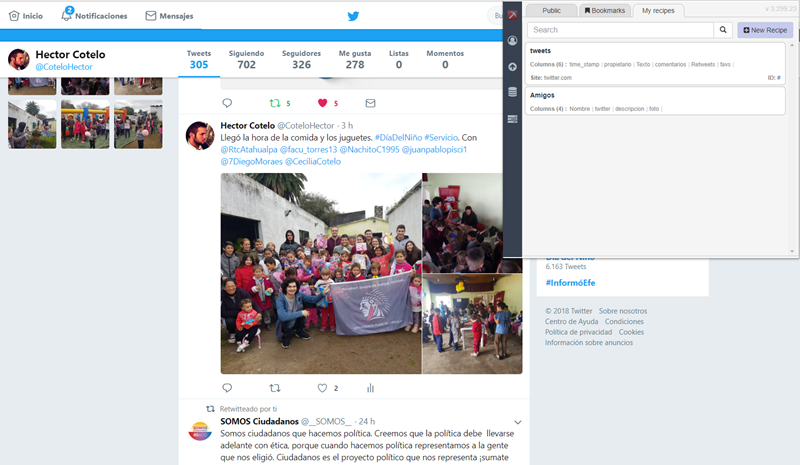
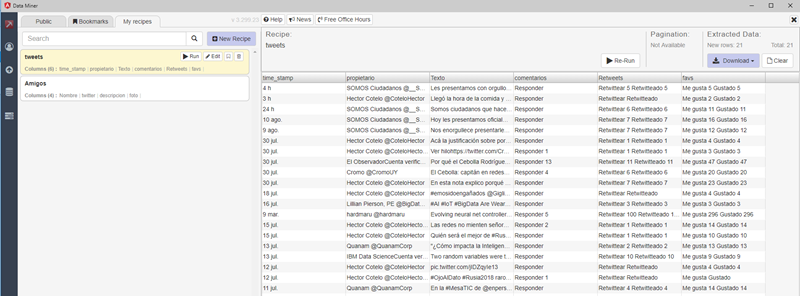
To overcome the obstacle, I scraped the page (scraping means transforming the unstructured content of a website into structured data, which can be stored in a database or in a sheet of paper) using DataMiner. By means of this tool I managed to make an (almost) ideal “recipe” that extracts data (almost) exactly as I want it.
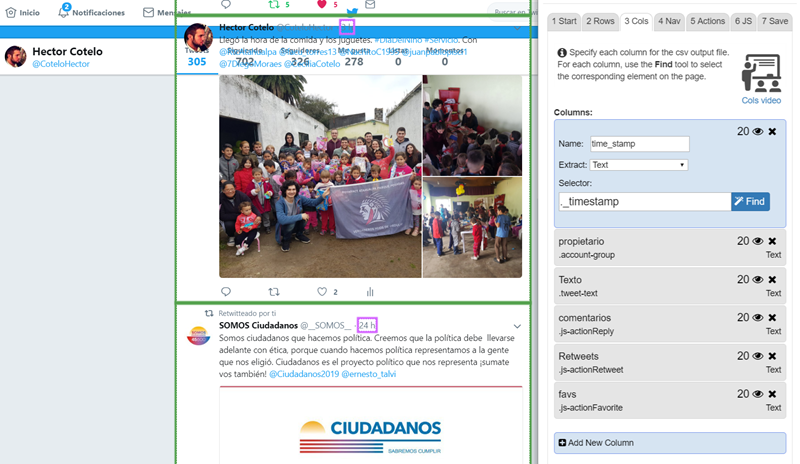
This part of the recipe’s definition:
And here is the outcome:
This is how I extracted all the tweets issued by the following candidates, from January 1, /1/2018 to August of the current year: Pablo Mieres, José Amorín Batlle, Fernando Amado, Verónica Alonso, Edgardo Novick, Luis Lacalle Pou, Carolina Cosse, Daniel Martínez, Jorge Larrañaga, and Ernesto Talvi.
Then I parsed the texts using Python, and implemented all the calculations that I explain below. When I shared the information, people asked more questions. So, I decided to insert all the data into a database because once the information is there, it was going to be faster (for me) to extract results than doing so through pure programming. Also, having the information in the DB I could use Business Analytics tools (I used Cognos) to draw graphs and so on.
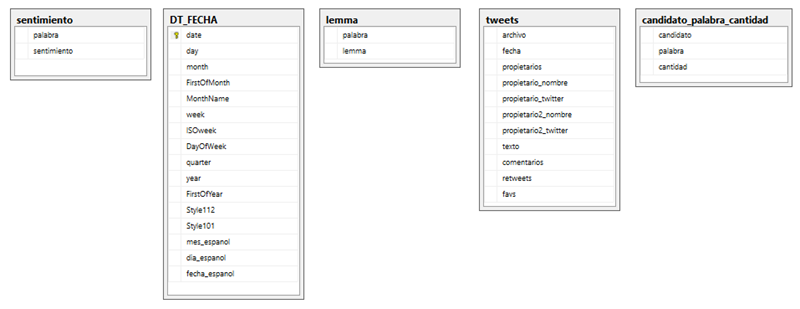
This is DB tables’ structure:
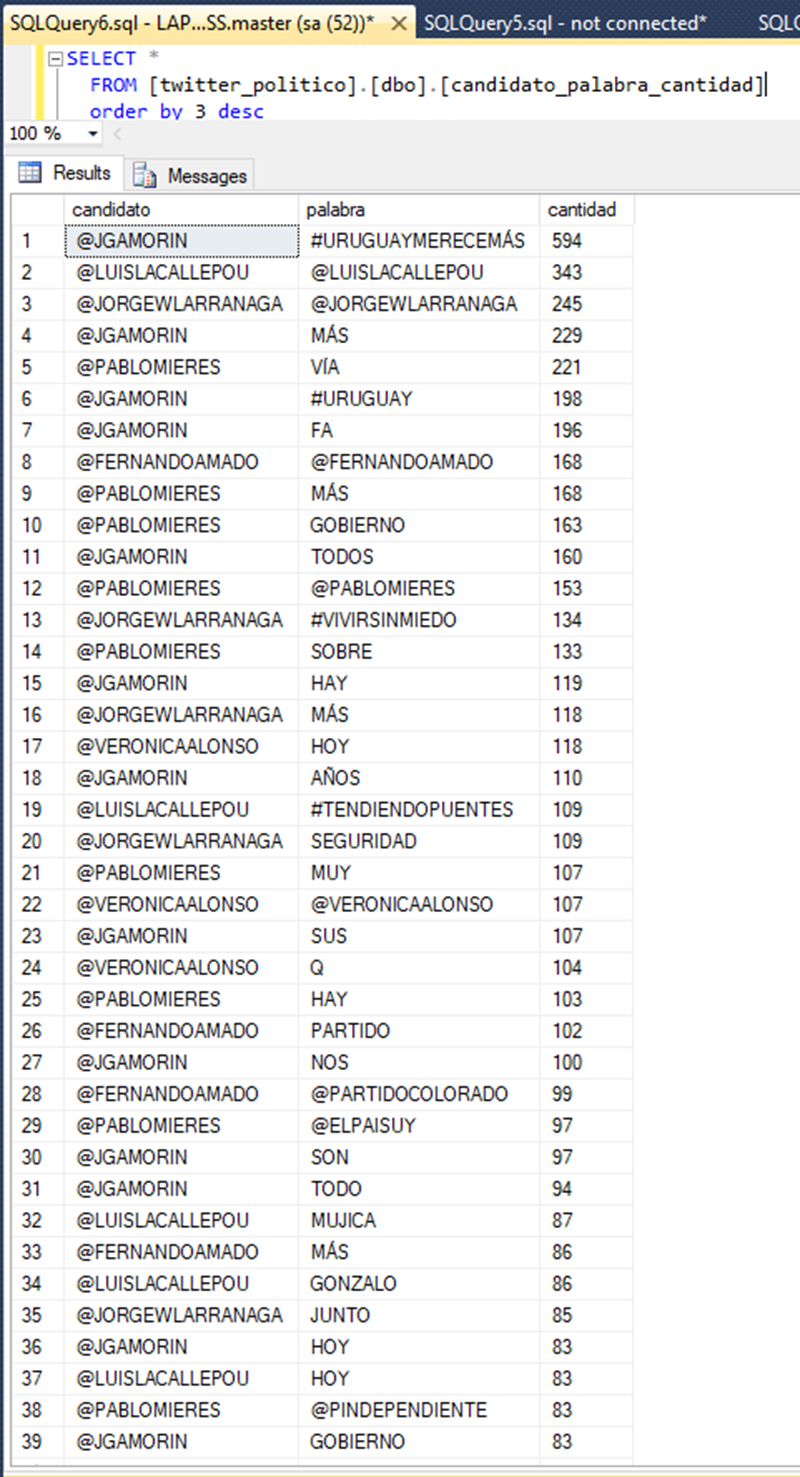
Here are some of the data stored in one of the tables:
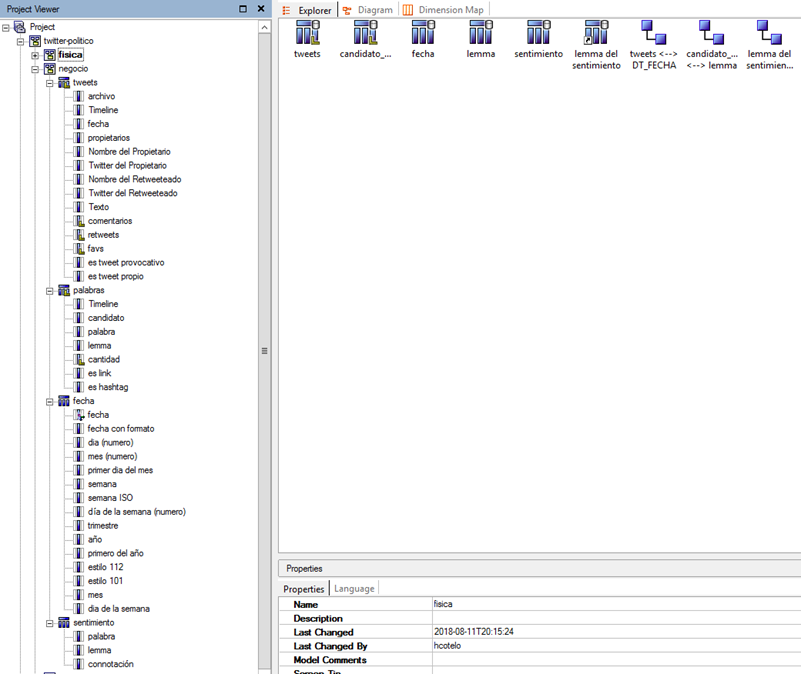
Also, a small amount of metadata was implemented in Cognos to prepare reports
Data Analytics & Information Management consultant.