

About the Visualization: Nightingale and Spear, two figures separated by nearly a century
Elena Ganón
Although my training was initially in Mathematical Statistics, then reading of Tukey’s work in Exploratory Data Analysis (known by the acronym EDA: “Exploratory Data Analysis”) and the French School of Data Analysis (“Analyse de Données”) led by Benzecri and disciples, which in 2011 celebrated its 50 years in Rennes, France, led me to the applied statistics and graphic representation of the data as a summary of small to large data sets. In recent years these various forms of presentation are called Visualization.
Last year I read some articles about two pioneer women in the area of Data Visualization and they reminded me, on the one hand, of my time in the fifth year of school when in some magazines in squares the lives of different characters were presented. There, I discovered one of them, Florence Nightingale, who along with Marie Curie were my idols of those years. The other, is the statistician of the Bureau of Labor Statistics, Mary Eleanor Spear.
Florence Nightingale, born in the 19th century and known primarily for being the founder of a discipline: modern nursing, was also a state health official in England and a pioneer statistician in the graphical presentation of data. For this reason, the Journal of the “Data Visualization Society” bears her name:Nightingale.
Daughter of English, she was born in 1820 in Florence, Italy (hence her name) and died in 1910 in England. As in the case of the English writer Virginia Woolf or the Belgian Marguerite Yourcenar, Florence was educated by her father, with access to the family library. A traveler, she toured Paris, Rome, Greece, Egypt and her published letters recount the journey along the Nile from 1849 to 1850.

Her book Notes on Nursing, states in the preface that women are the ones who are in charge of care,
an approach that persists in the practice until now:
“The following notes are by no means intended as a rule of thought by which nurses can teach themselves to nurse, still less as a manual to teach nurses to nurse. They are meant simply to give hints for thought to women who have personal charge of the health of others. Every woman, or at least almost every woman, in England has, at one time or another of her life, charge of the personal health of somebody, whether child or invalid,–in other words, every woman is a nurse.”
Florence Nightingale. “Notes on Nursing: What It is, and What it Is Not “. CreateSpace Independent Publishing Platform. Ed de Kindle.
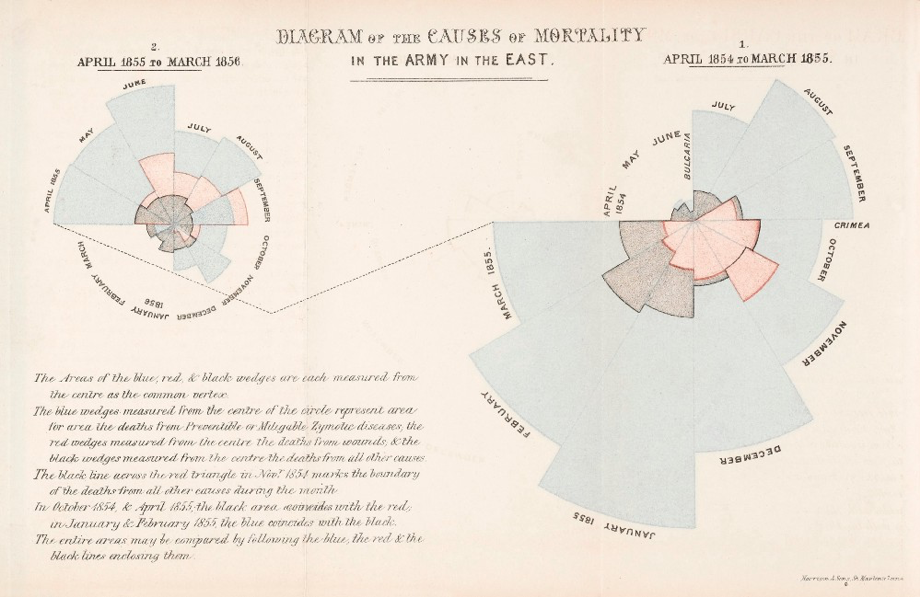
Florence witnessed the horrors of the Crimean War, where she arrived with a group of nurses in November 1854. She succeeded that the English government sent them a prefabricated hospital and in 1860, thanks to a fund created with donations, she led the construction of the “Nightingale Training School at St Thomas’ Hospital”, a training school for nurses. Her graphic presentation of the deaths of combatants in the Crimean War is famous, indicating that they died more from sanitary conditions than from wounds in combat.
She was also a pioneer in sanitary recommendations, such as wastewater management, in the case of India.
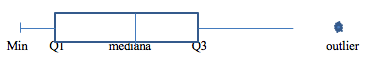
Mary Eleanor Hunt Spear, author of two books on graphic presentation published in the 1950s and 1960s (1952, 1969), was born in the United States in 1897 and died in 1986. Her career as a statistician and specialist in graphic presentations took place at several U.S. government institutes. It was only last year (Jones (2019)) that I discovered that she was the creator of the box-plot or box diagram that allows graphical analysis of the presence of extreme points (“outliers”) and the symmetry and normality of the data.
The articles in general give Tukey authorship of the box-plot, who slightly modified Spear’s version. Tukey’s contributions to statistics are many, either in EDA, or in spectral analysis (the FFT Fast Fourier Transform). The latter makes it possible to calculate the spectrum of a time series and graph it later, performing the analysis of a time series in the frequency domain instead of in the time domain. That is, a non-parametric analysis against a modelling.
Spear worked at a time when presentations were drawn, and she explains the importance of forming a multidisciplinary team to carry out a good visualization: at least it included a statistician, a draftsman and someone in the domain of data knowledge. This has been lost because we have computer programs or applications that give us the result easily and we do not think about the quality of the diffusion.
The box-plot or box diagram or 5 points is very easy to make, either with pencil and paper even with an electronic spreadsheet or directly with the pre-prepared application where the data is loaded and the visualization is obtained. It is necessary to calculate the minimum, the median, the 2 quartiles (Q1 and Q3) and the maximum of the data, calculate the inter-quartile distance multiplied by 1.3 and add it to the third quartile or subtract it from the first quartile. Points on the outside are extreme points.
In an Evergreen article (2019) it is suggested that in general only Florence Nightingale is cited as a forerunner in articles on the history of visualization and other women are not remembered, such as Emma Willard, also from the 19th century.
Bibliography
Florence Nightingale (1859) “Notes on Nursing, What it is, and what is not”
Dover Publications; 1st Edition (June 1st 1969)
Florence Nightingale ( ) – “To Her Nurses”
Book Jungle; New Edition (May 11th 2007) Reprint MJPublishers. 2018
Florence Nightingale (1854) “Letters from Egypt,”
Mary Eleanor Spear (1952) “Charting Statistics”. McGraw-Hill
Mary Eleanor Spear (1969) “Practical charting techniques”. McGraw-Hill
John Tukey (1970) “Exploratory Data Analysis”- 1st Edition.
Ralph B. Blackman, John Tukey (1958) “The Measurement of Power Spectra”
Dover Publications, Inc
Ben Jones (2019) “Credit Where Credit is Due: Mary Eleanor Spear”
The Journal of the Data Visualization Society July, 2019.
Stefanis Evergreen (2019) “Beyond Nightingale: Being a woman in Data Visualization”. Nightingale, The Journal of the Data Visualization Society August, 2019.