
Integration between Cognos Analytics and Jupyter Notebook in practice
In the first part of this article we saw the steps and requirements we need to follow to have a successfull integration between Cognos and Jupyter Notebooks as well as the benefits of said integration.
Now is time to see the integration between Cognos Analytics and Jupyter Notebook in practice and for that we will see some examples of Cognos Analytics, of how to use content in a Notebook, apply certain analyzes and transformations on the data; in addition to viewing it on a dashboard.
In the following image we will see how the files that I have already uploaded to Cognos Analytics will be read and subsequently how to combine them into a single pandas.DataFrame (it consists of a data structure of the pandas library used to handle data objects as if they were tables).
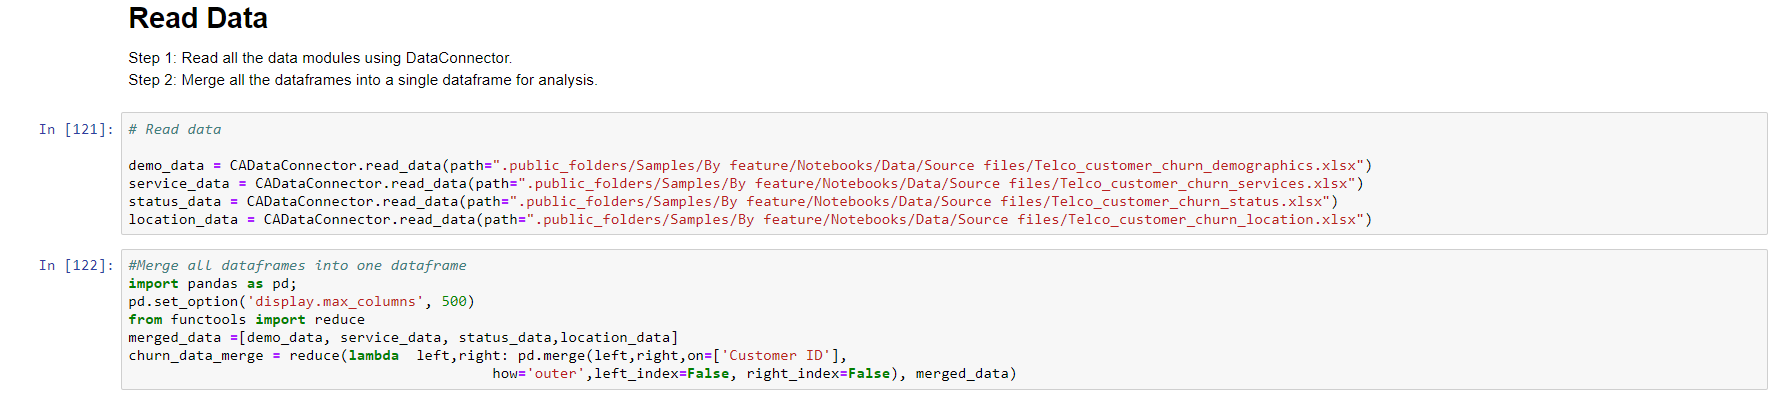
Then, if desired, you can save the joined files as a new file in IBM Cognos and read it again to continue with the analysis of the data.


So far I would have my data for analysis in the dataframe “churn_data_merge”.
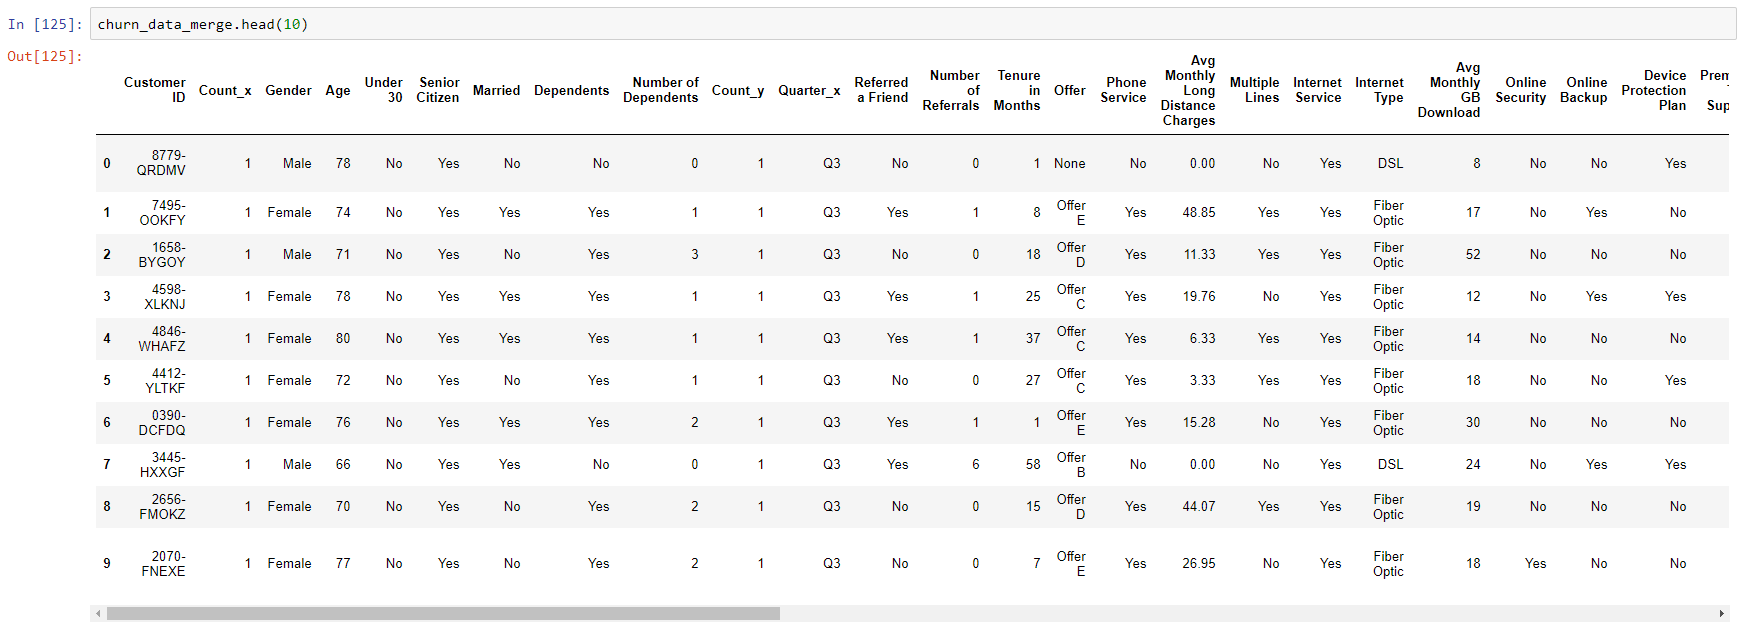
Different functions can be applied to this object to explore the data, such as seeing the first 10 records, as shown in the following image:
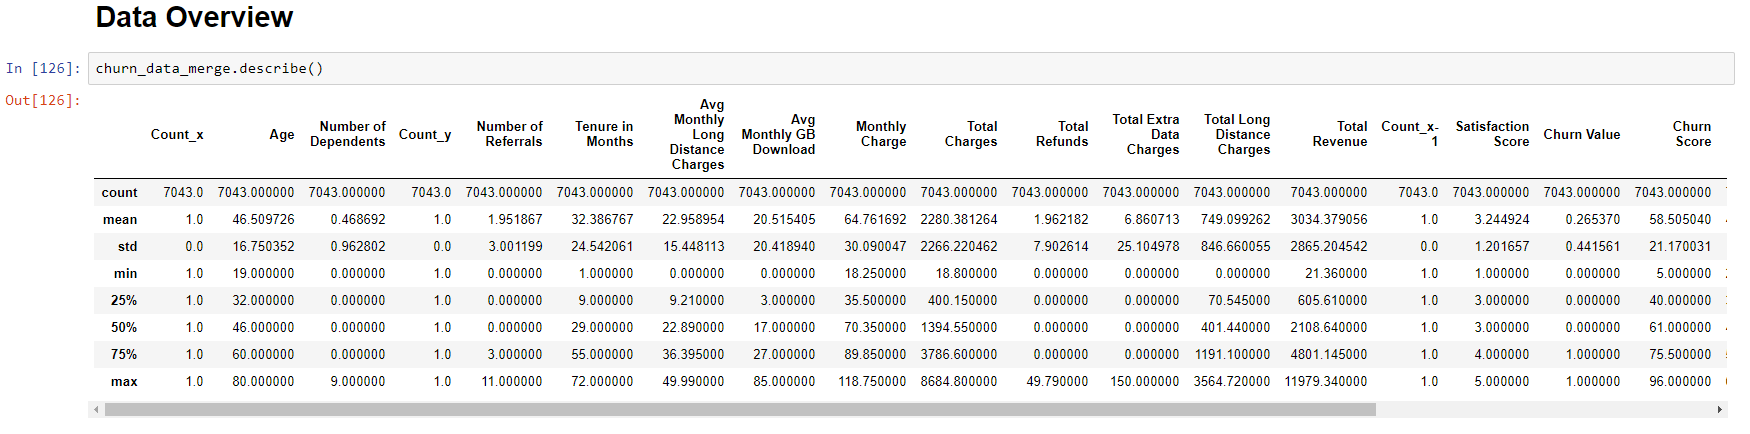
Or a function that describes the variables of this data:
It is also possible to install packages, such as data profiling. Let’s see the following image:
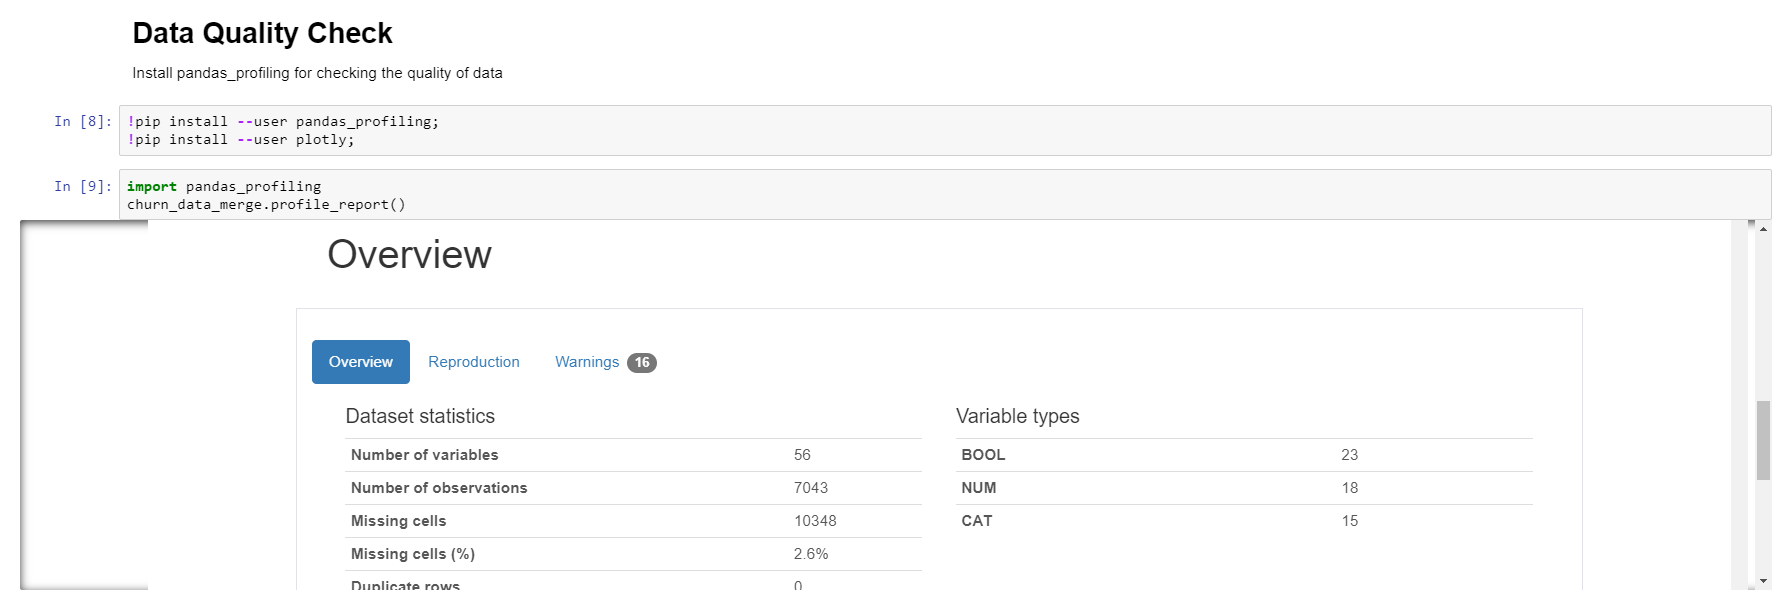
The generated report indicates the different types of variables found, among many other things. For example, it reports that 56 variables were found, of which 23 are Boolean, 18 numerical and 15 categorical, number of cells with null values, etc.
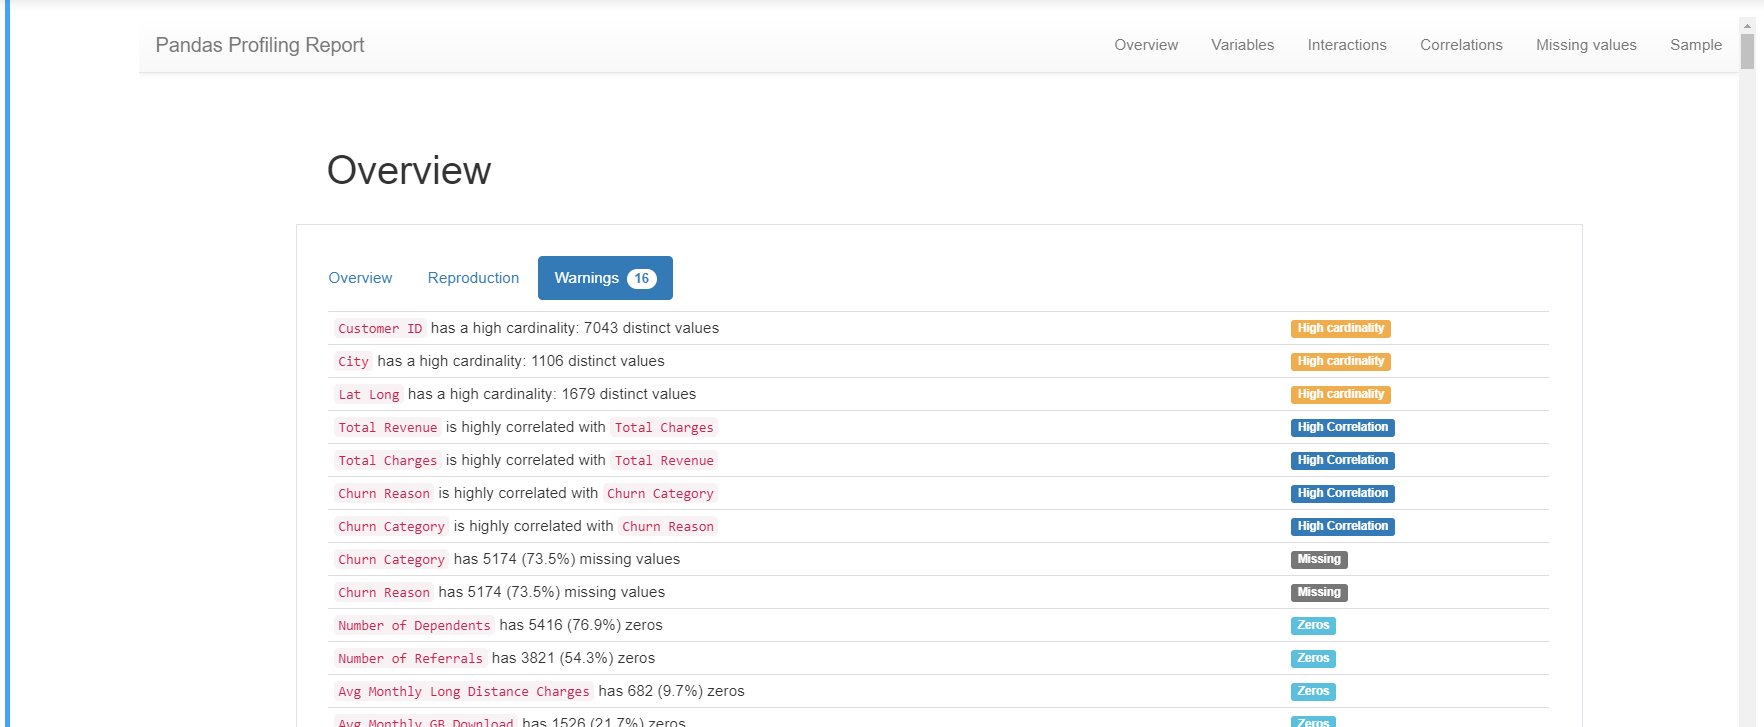
It also shows warnings of variables with high percentages of zero or null values.
By having the data in a dataframe of the Python pandas library, you can take advantage of all the features of this object to explore/analyze our information.
As we already indicated, it is possible to create visualizations and some of the libraries that can be used are Matplotlib, Pandas Visualization, Seaborn, Plotly. Let’s see an example:
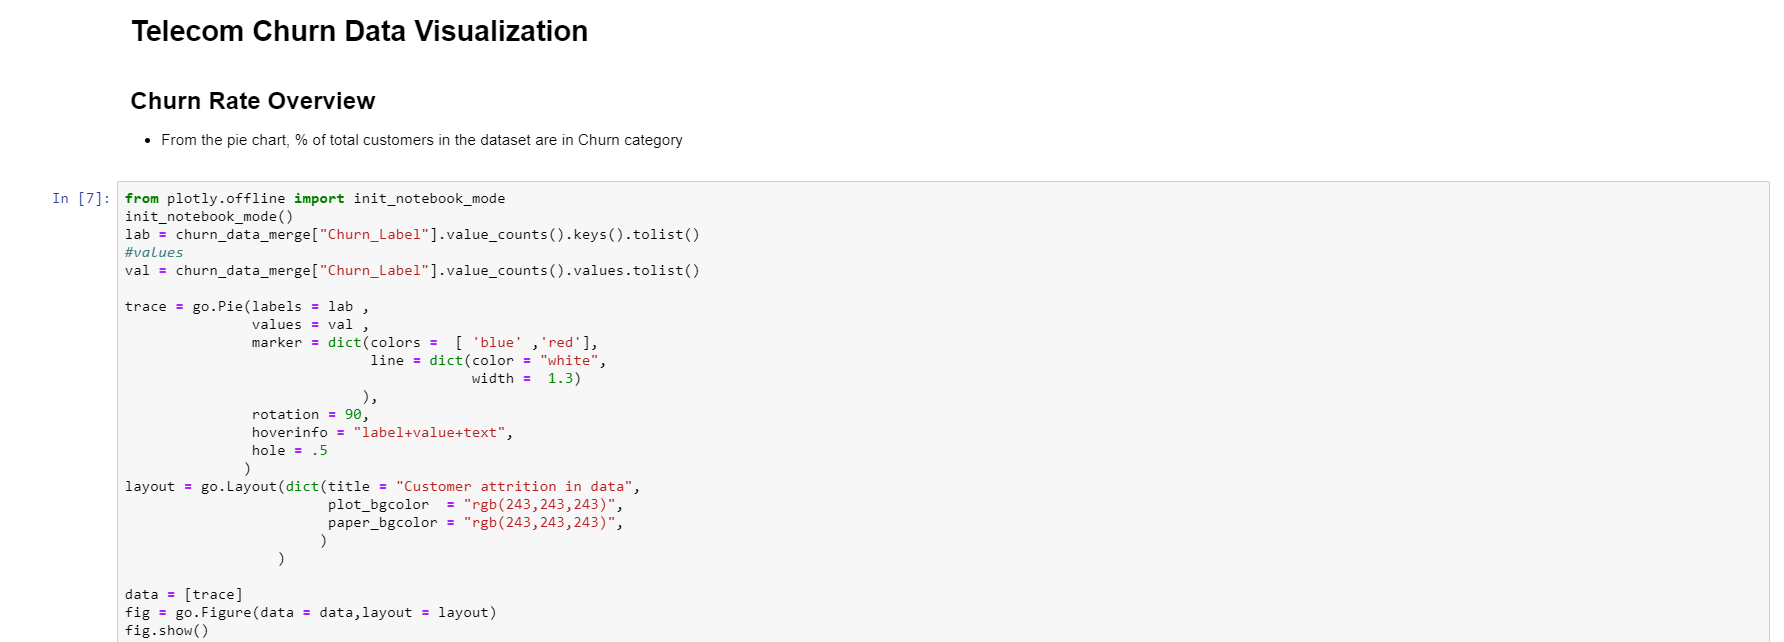
The previous code produces the following output:
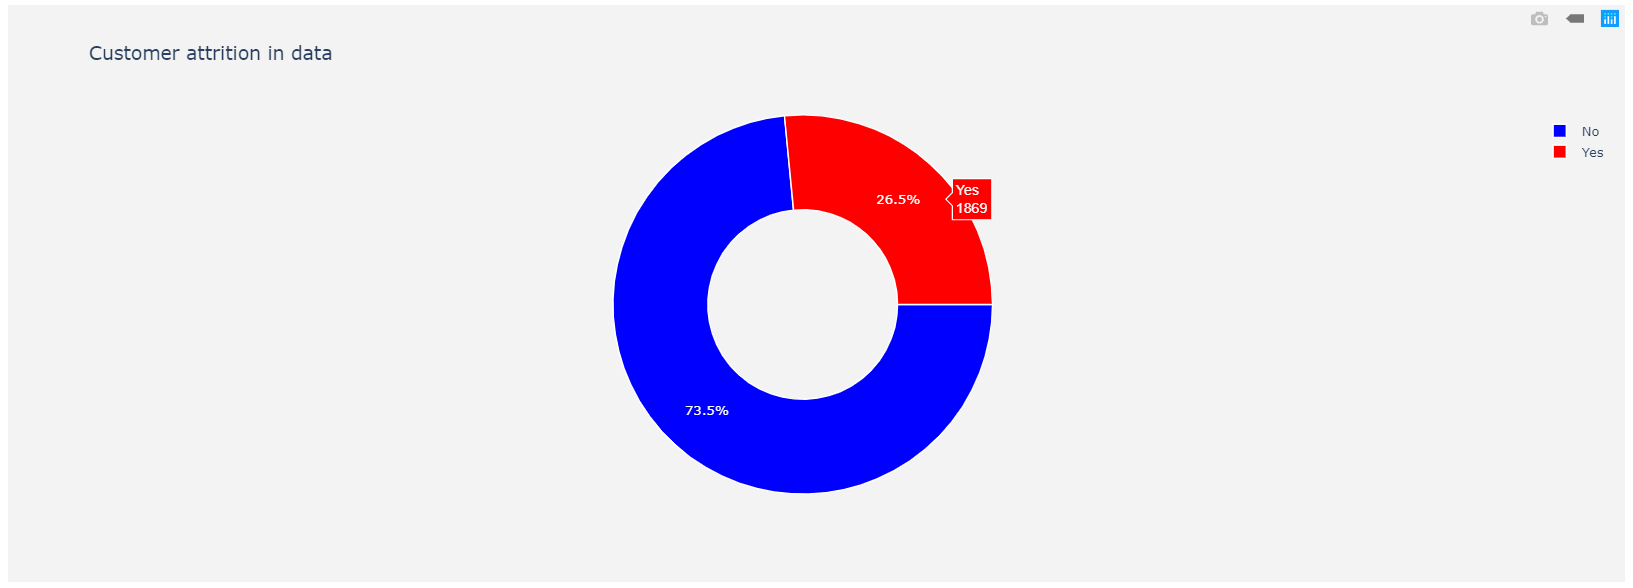
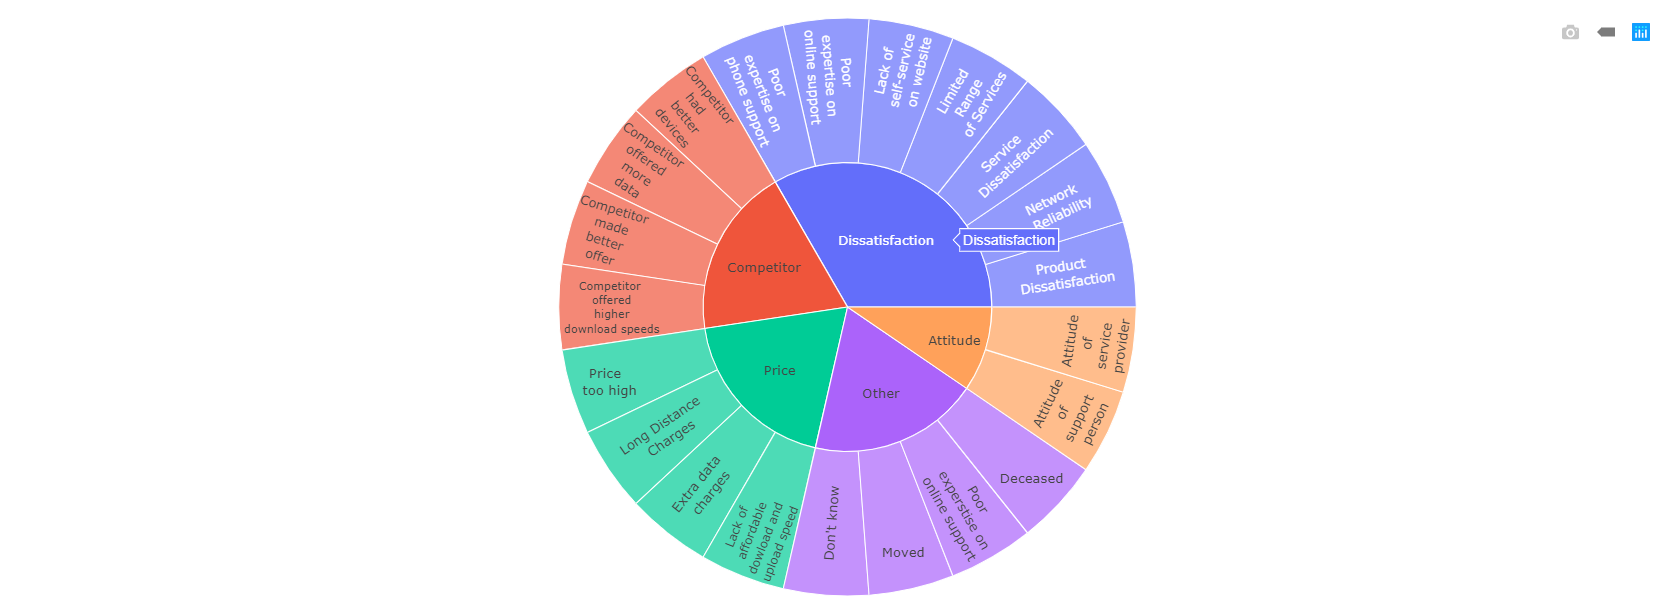
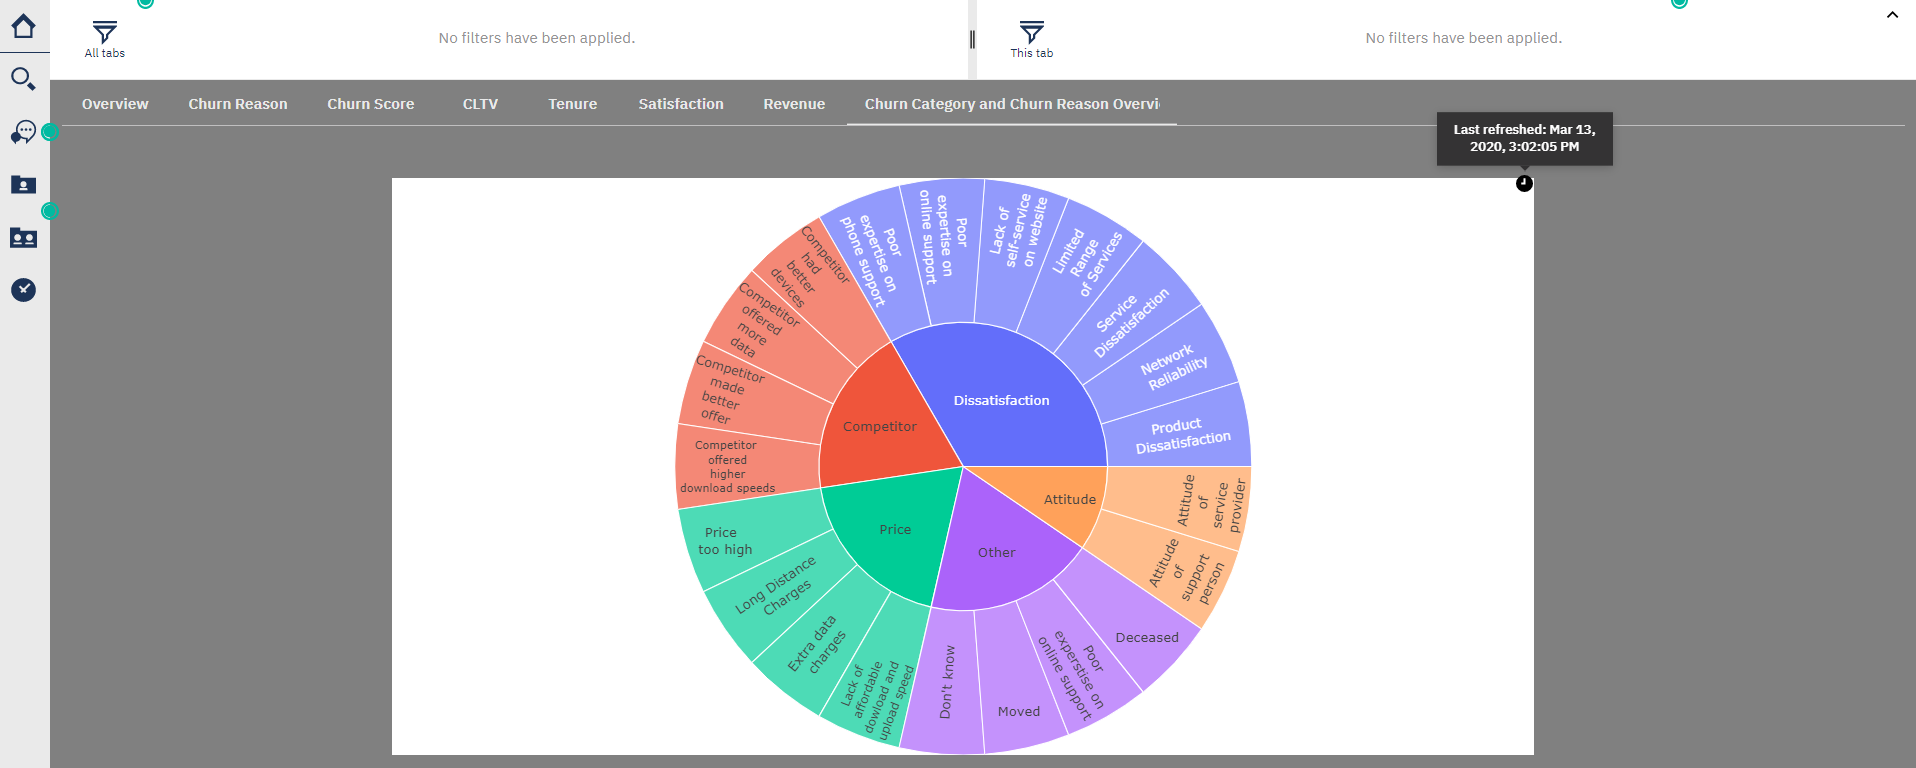
But you can also have more elaborate visualizations such as the following in the integration between Cognos Analytics and Jupyter Notebook in practice.
Churn Category and Churn Reason Overview
And best of all, these visualizations, as well as any notebook output, can be inserted into a dashboard, story or report.
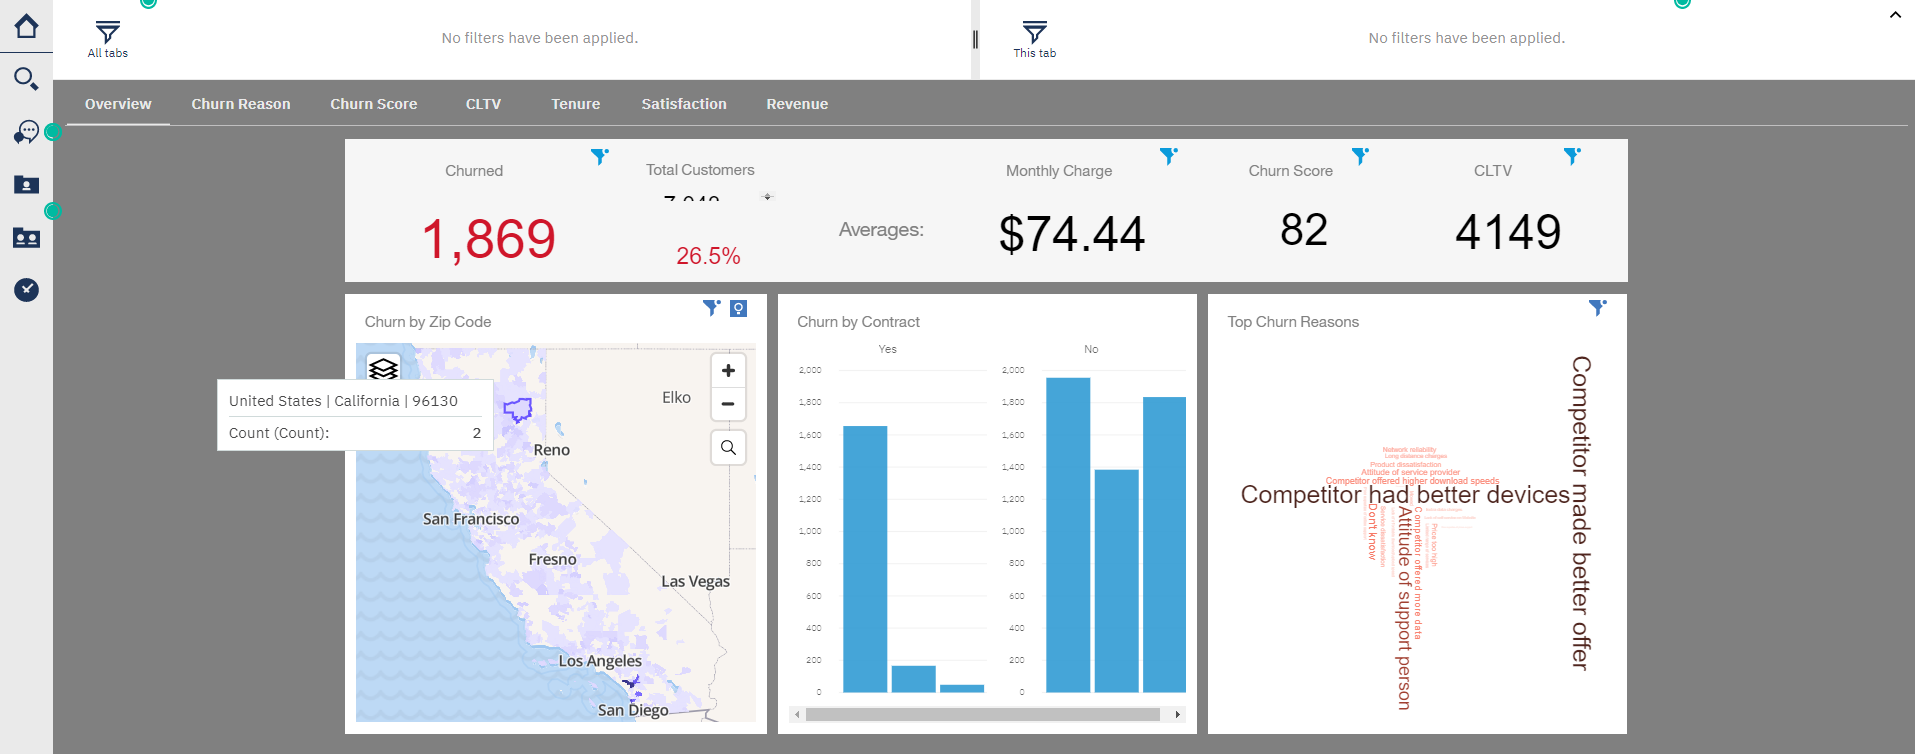
For example, we have the following dashboard:
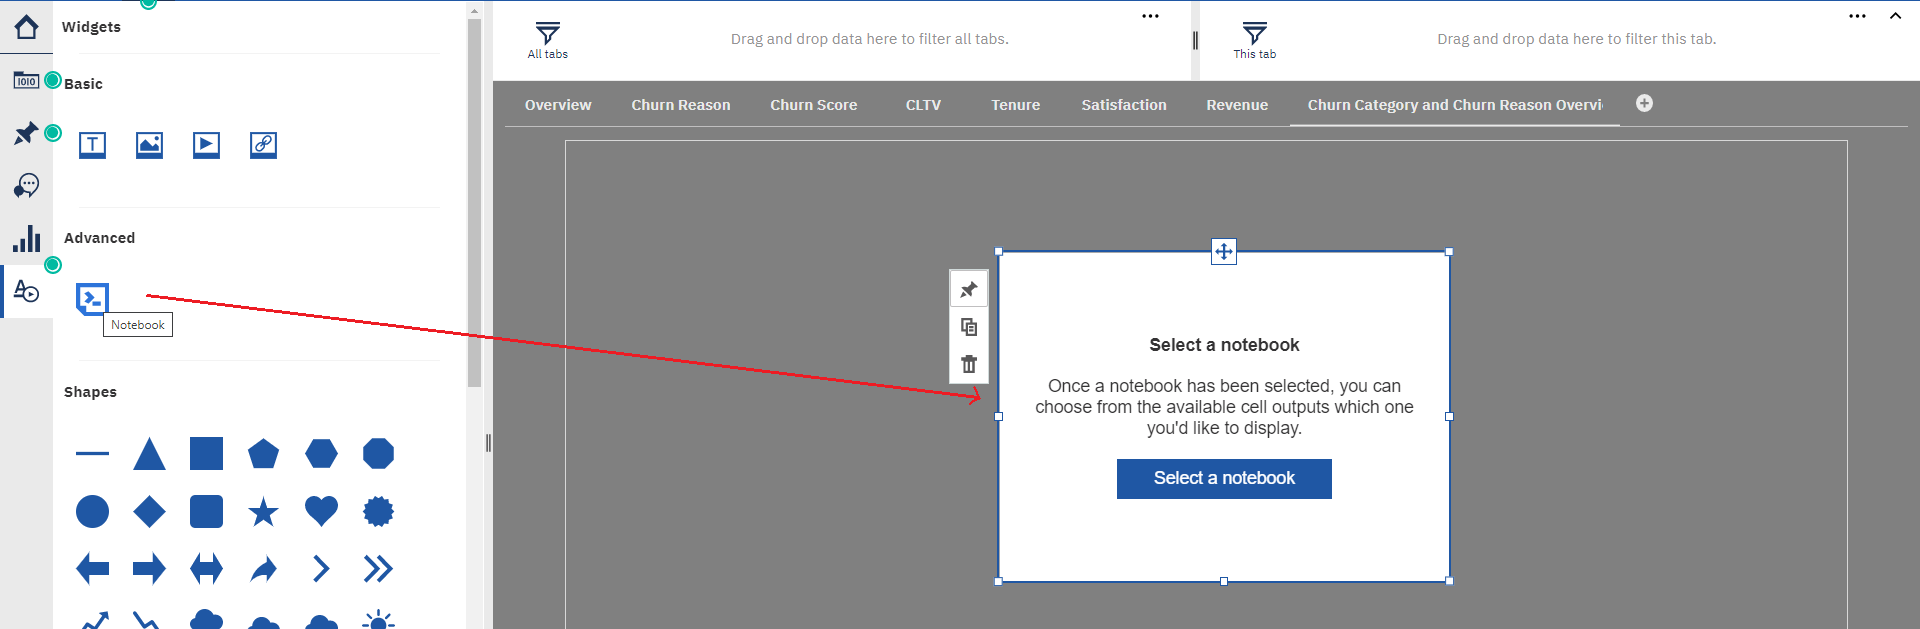
To the above, we can add one more tab, with the previous visualization obtained from a Notebook. Inside the widgets, we now see an Advanced section that allows us to add a Notebook:
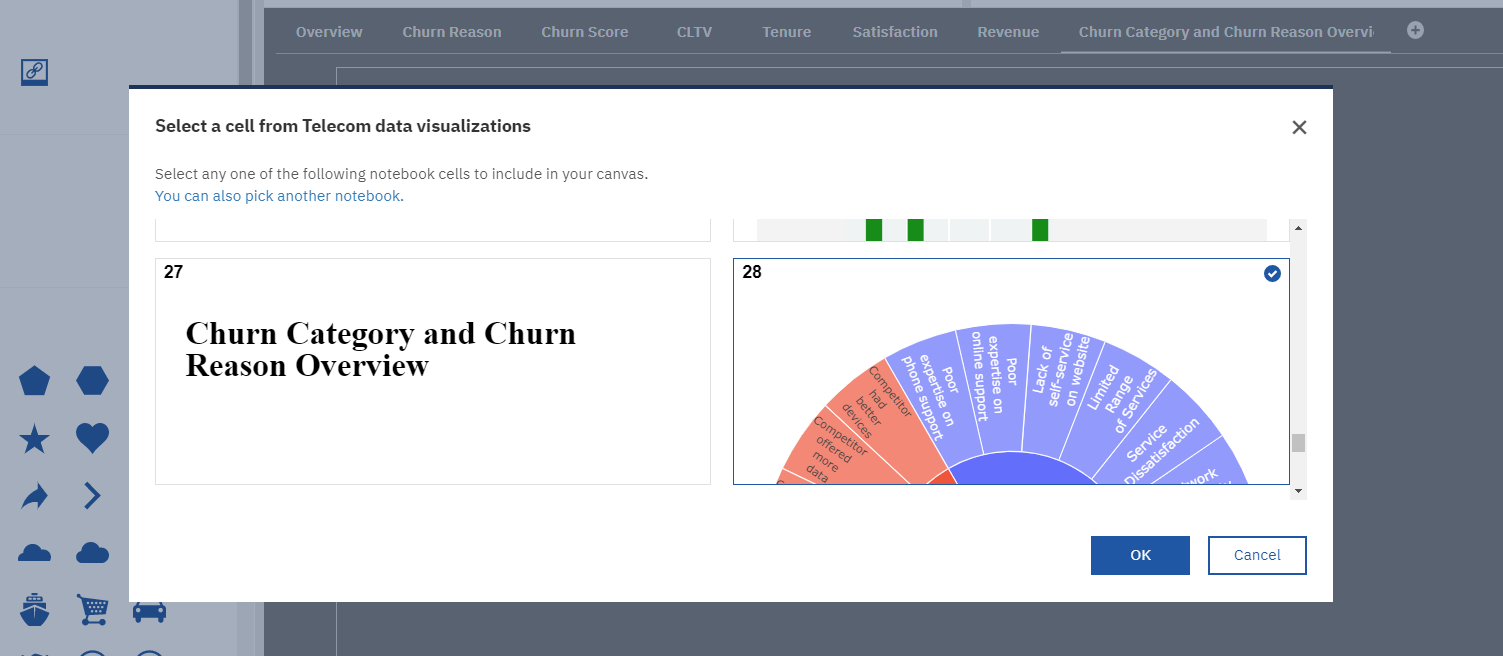
By selecting the Notebook we can choose the output we need, within all that it has and add it to the dashboard tab.
In the following image we see the output of the Notebook in the new tab and at the top right you can see the latest update of the one we import.
But if you prefer, in the same tab, you can also combine visualizations of Cognos and Notebooks.
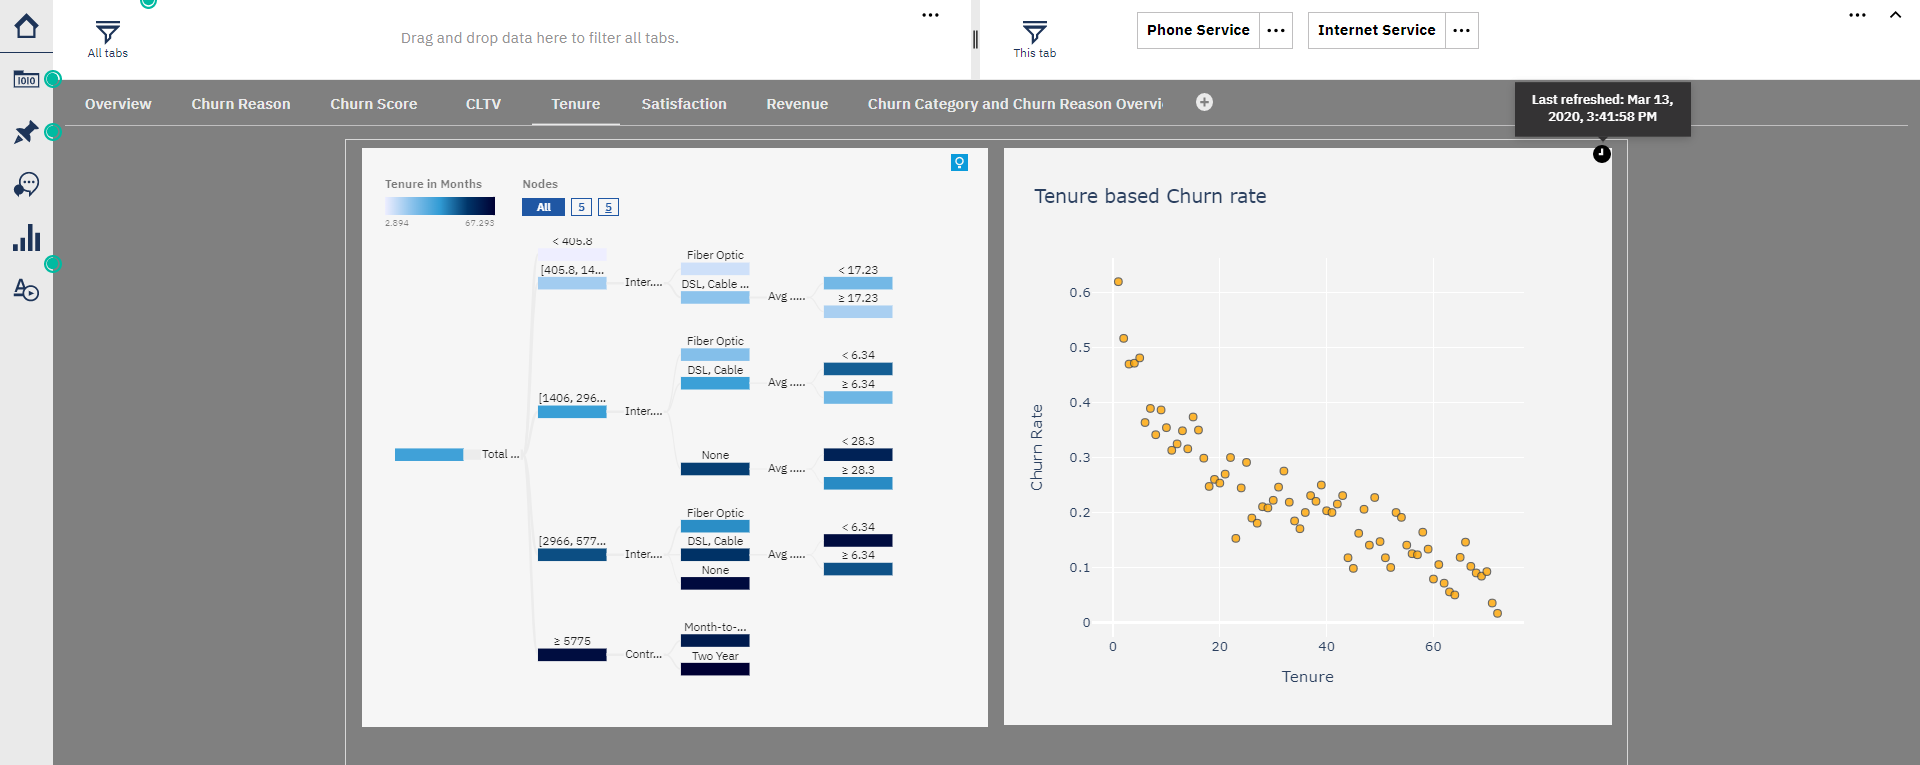
The one in the left is form Cognos while the one in the right is from a Notebook.
It is necessary to clarify that to use Jupyter Notebooks, certain programming and statistical knowledge (along with existing libraries in Python) is required to perform the tasks related to the role of data scientist and thus obtain the greatest benefit that this tool provides. It should be noted that the visualizations are not created as naturally as in a dashboard or report (drag and drop elements from a data source to the graph), but require the programming knowledge mentioned above, in addition to the structures of data and libraries to use.
As you can see, we have interaction on both sides between IBM Cognos Analytics and Jupyter Notebooks. We can create a Notebook, take data from Cognos, analyze them, transform them, to generate new content (both data and visualizations) and then be able to use them in the tools of IBM Cognos Analytics.
Marcelo Celio
Computing Engineer / Data & Analytics consultant