

Where is more necessary to build Secondary schools? Part III
Although in the second part of the article I mentioned the change in the approach to the solution, I did not get good solutions. Evidently, by only using the distance to the nearest school factor, the algorithm did not foretell good places to build the next schools. It was necessary to add more variables to the analysis which represented the education and socioeconomic level of the area under analysis.
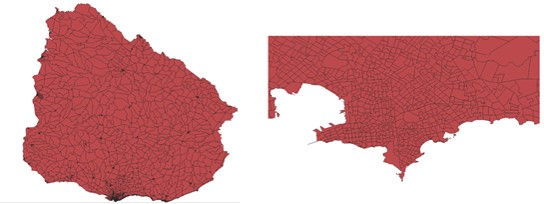
To improve that I downloaded information about the people taken from Encuesta Continua de Hogares 2018 (Spanish for: Continuous Household Survey 2018); the survey shows the census segment in which every person lives. The INE ( Spanish for: Statistics National Institute) also provides a shapefile with census segments.
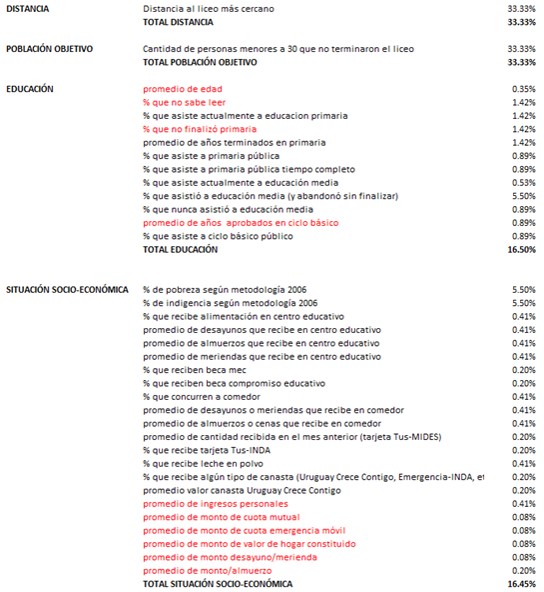
We had to choose, from over 400 variables that the survey shows, those that represented this case. With the help from Germán Cotelo (ORT University), Romina Superreguy (ORT University) and Cecilia Cotelo (Itaú Bank), we selected the variables we should use:
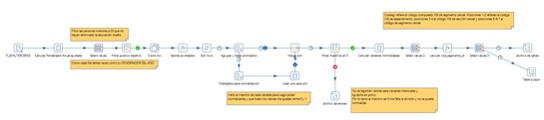
By summarizing the information (find averages) to have it at the census segment level and not as a person, filtering it so I could keep only people under 30 who have not finished high school yet, pivoting the values of the variables, and normalizing the values so that each variable always goes from 0 to 1, etc., I had to go through a process in Pentaho Data Integrator (Kettle/Spoon).
At the end of the process the table is loaded, for each variable of the defined ones it has the real value and the normalized value.
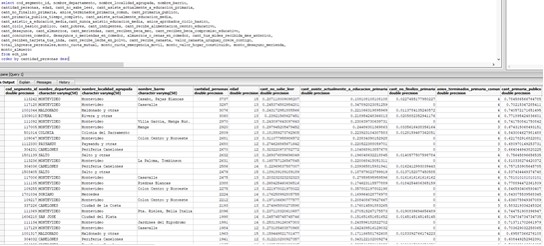
To show the score of each census segment according to what was defined I created a view.
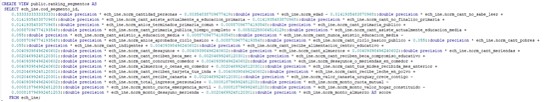
Having all of that ready, the Query to have the number of spots chosen is as follows:
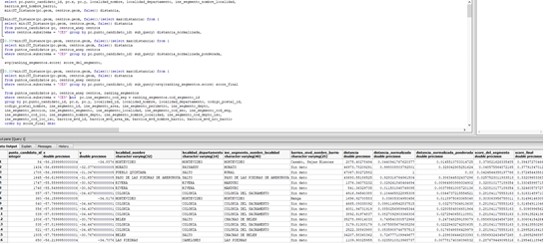
The first spot is added to the table pertaining to centers_anep with a flag that indicates that it is invented, and then it is run again as the distance to the nearest secondary school has to be recalculated, taking into account the new schools built. Actually, the real version I used was this one that geom gives you and everything is ready to be entered:

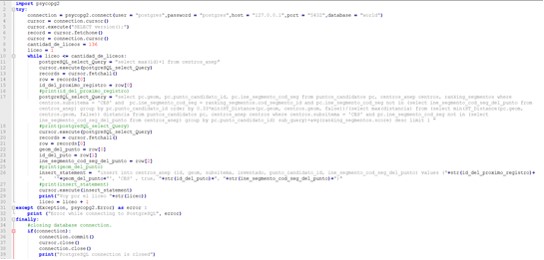
In the Python code:
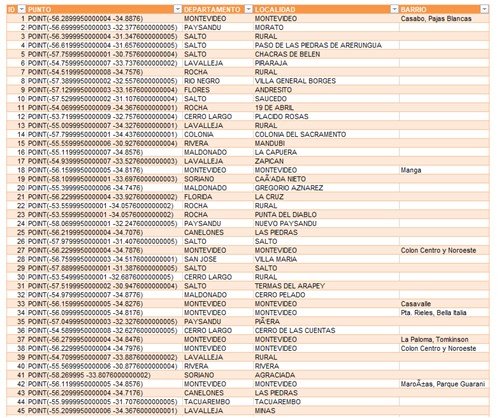
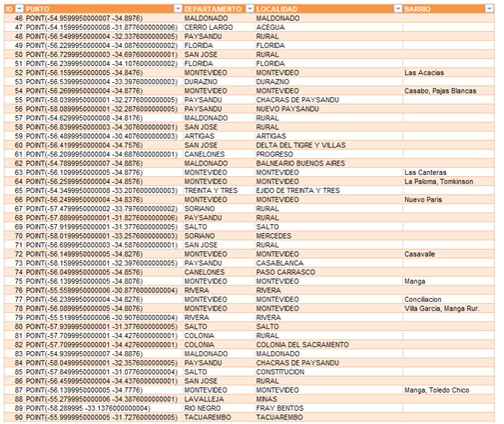
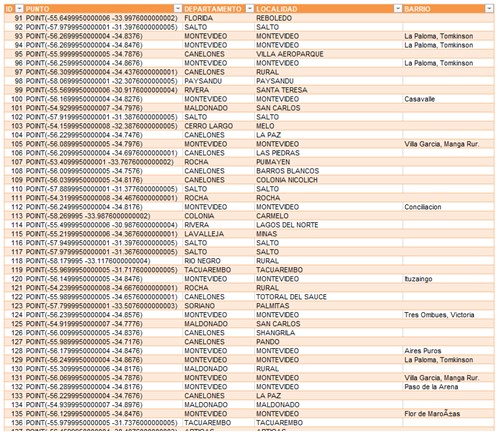
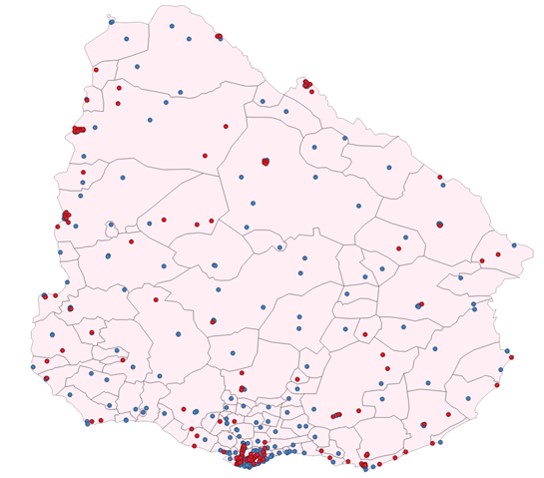
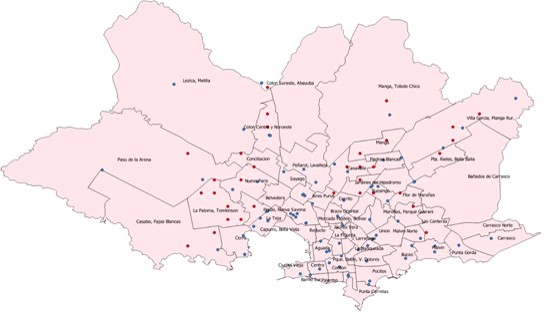
And the result is the following:
Conclusions
There are several interesting tools to use: geopandas, fiona, shapely, pyproj, geopyspark, and arcpy
The Spatial Data Science is growing strong. There are many business problems that can be solved by these tools. From problems very similar to the one that was solved and mentioned in this article (where an ATM, a polyclinic or a new supermarket should be located) to more complex matters such as:
• Which areas are best to buy lands to invest.
• Verify if there is a special pattern that determines the prevalence of any disease, and if it does, find out what regional factors contribute to a greater or lesser prevalence of diseases
• Excellent design for a surveillance network using cameras, whether for defense, traffic control, theft prevention, etc.
• Route optimization
Business Analytics & Information Management consultant.