

Where is more necessary to build secondary schools? Part II
In the first part of the analysis I promised not to give up in the search of other possible solutions, taking into account other approaches to determine where was Uruguay in greatest need of the building of these secondary schools. As mentioned in the first chapter, the first solution we reached was not convincing (and sparked discussions in social media). I could not come up with a way to solve that, so I spoke to two friends from university and secondary school: Guillermo Álvarez (Vaadin) and with Andrés Ambrois (Google). Both agreed that a simpler version to the problem was to look for geographical spots that are more distant form each secondary school which could be done by taking a grid of equidistant spots, and to sort them according to their distance to the nearest secondary school.
So, I searched which were Uruguay’s limits, so I could do my gird of equidistant spots:
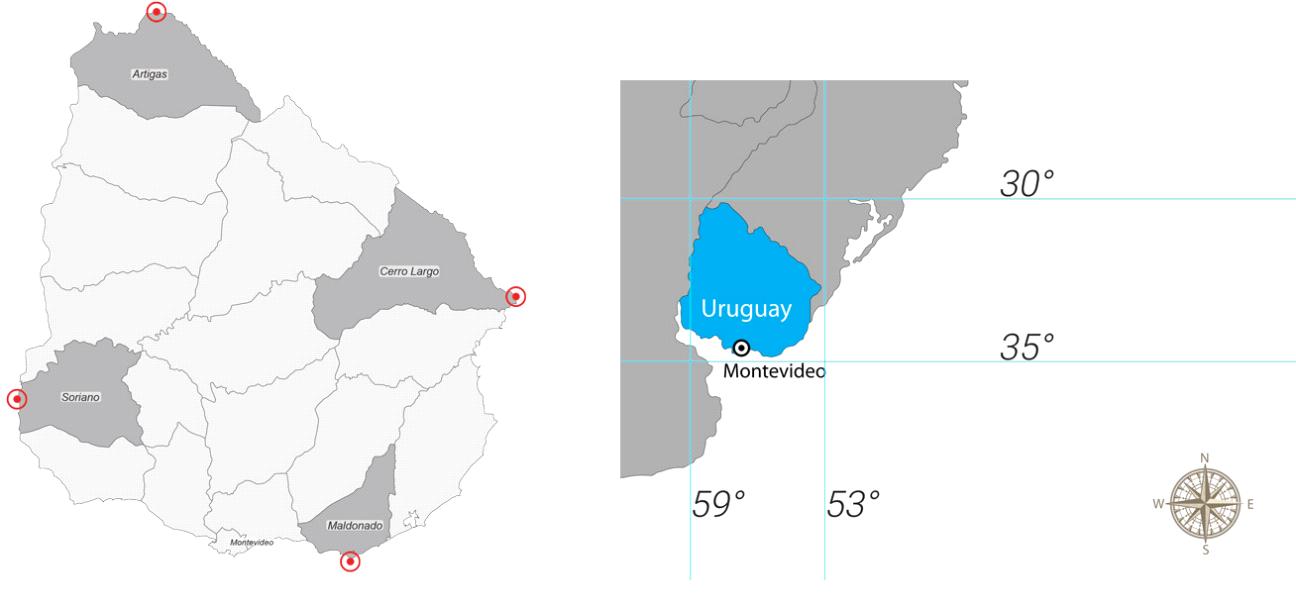
The spots would be: ymax = -30.0508, ymin = -34.9376, xmin = -58.4200 y xmax = -53.1107 precisely. With those limits I could build two nested loops and increase both x and y by 0.01 to make the grid.
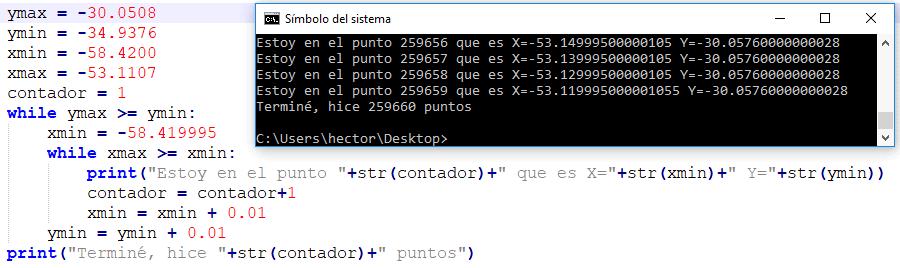
In total there are 259.600 spots, approximately one every ten blocks.
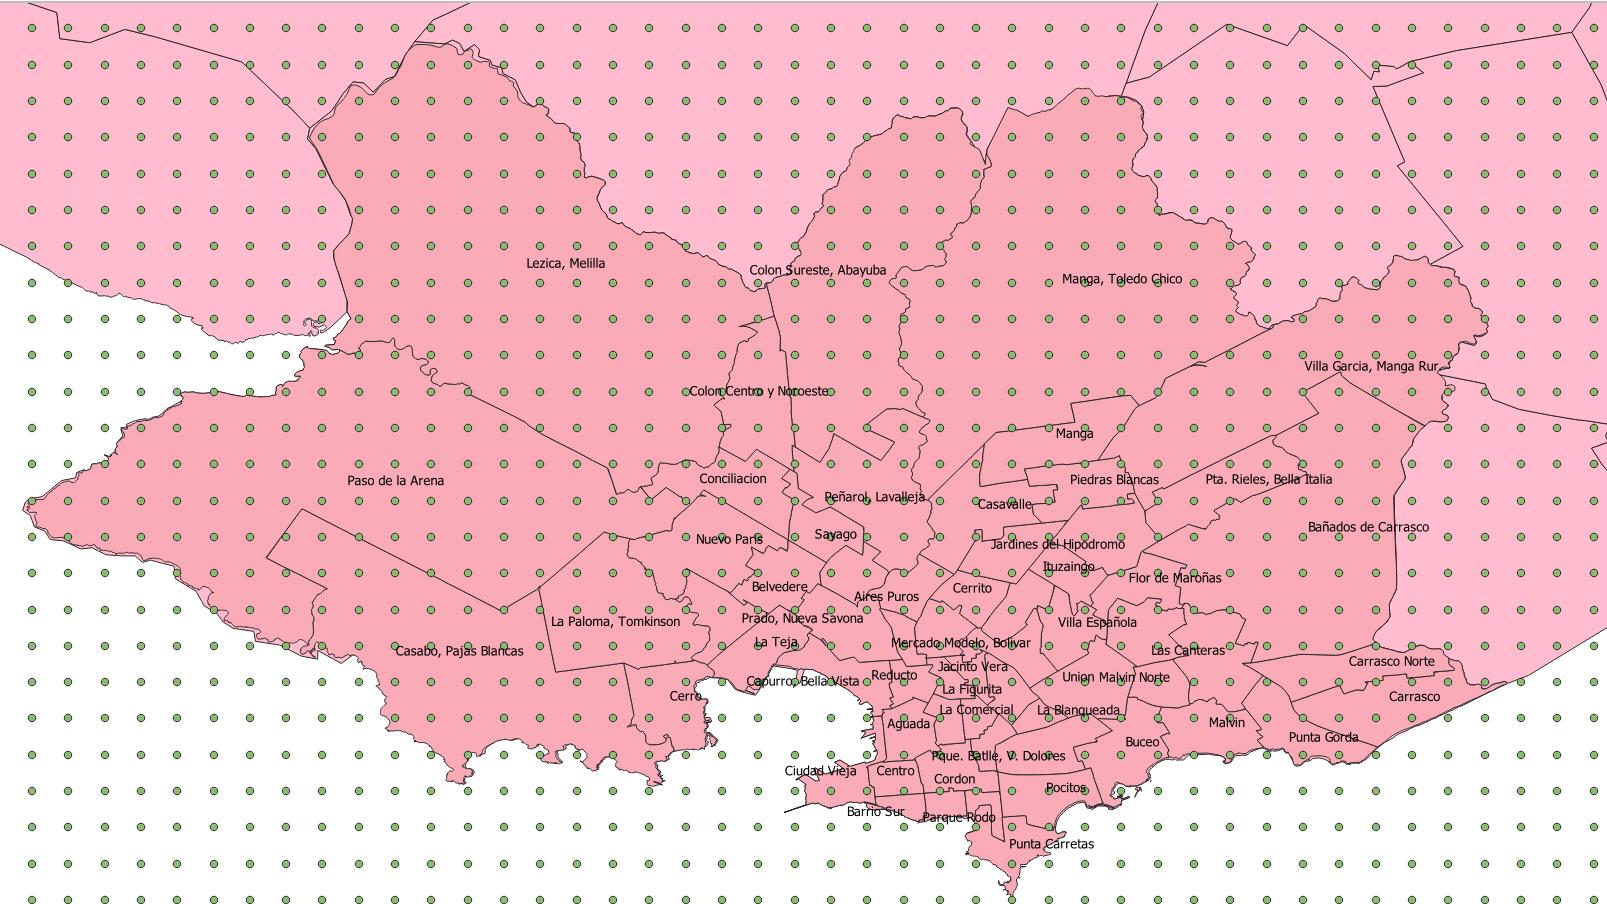
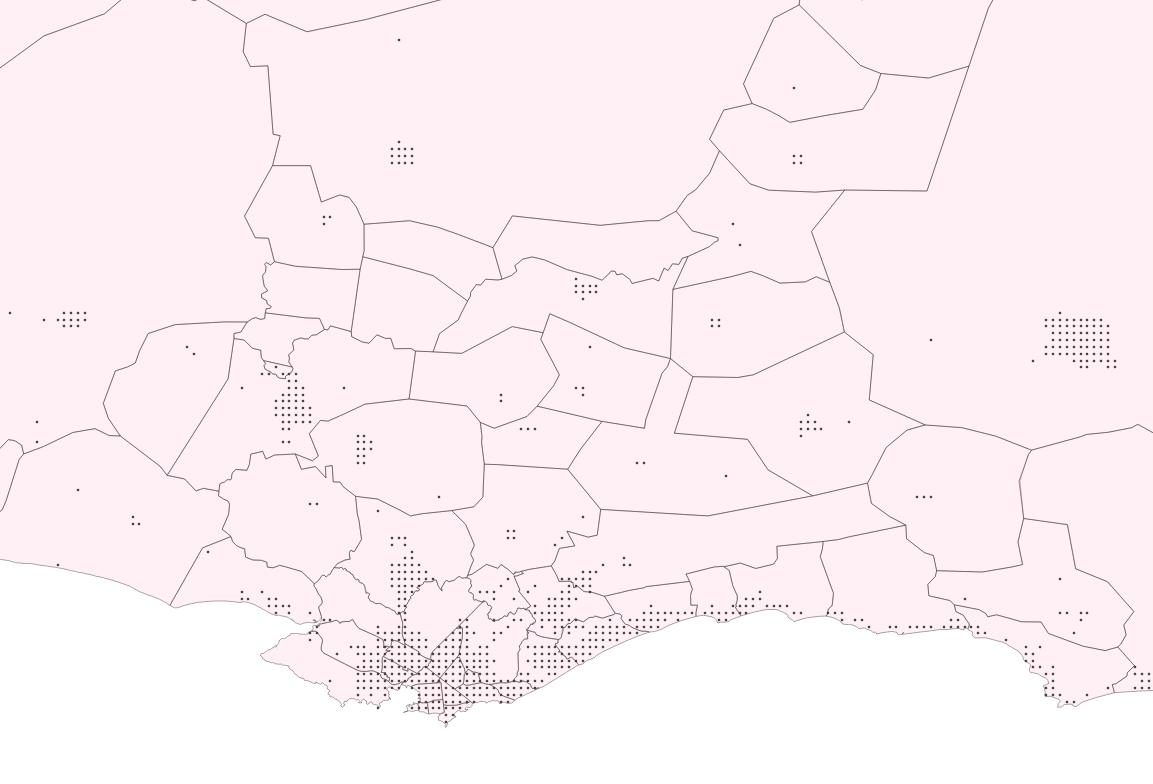
We enlarged the zone of Montevideo:
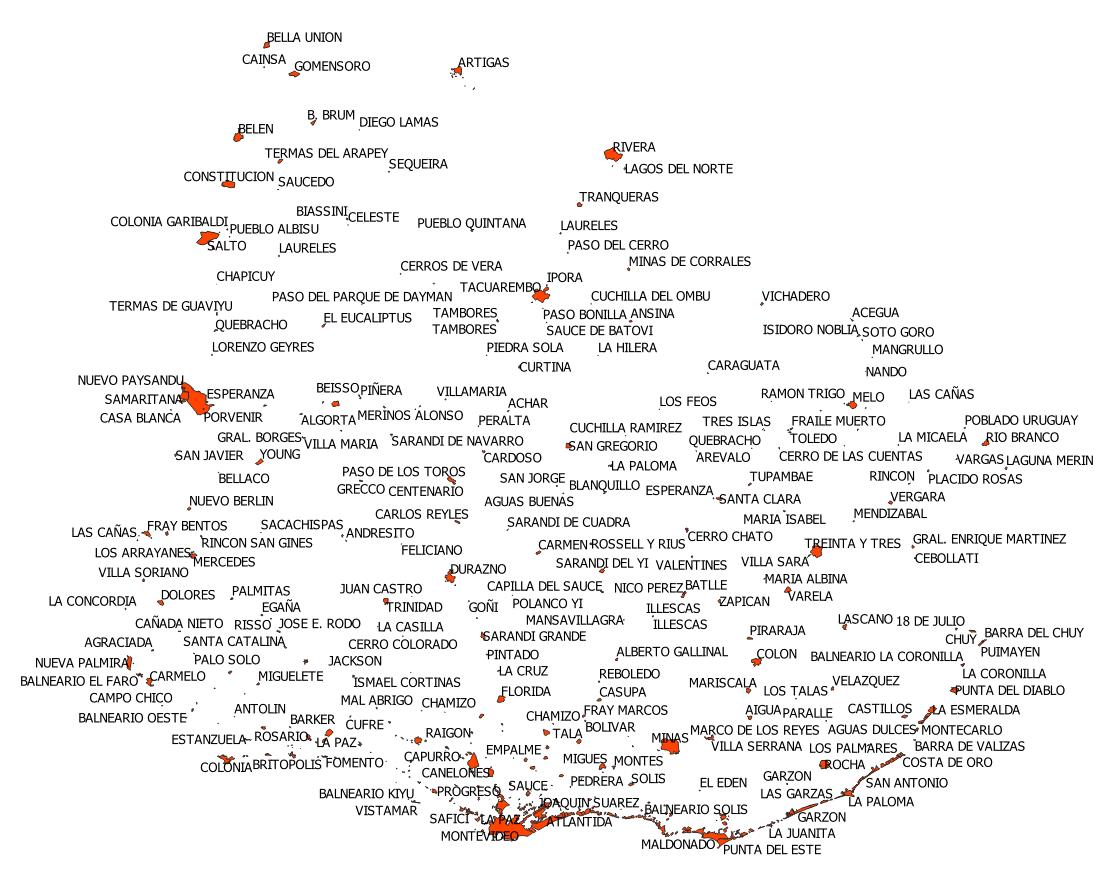
Once the grid is done, we have to find the distance between each of these spots and the secondary schools that are closest to each of them. The spot that is furthest away from a secondary school closest to it is where the first secondary school should be built. If we repeat that 136 times, we will have the location for every secondary school we have to build.
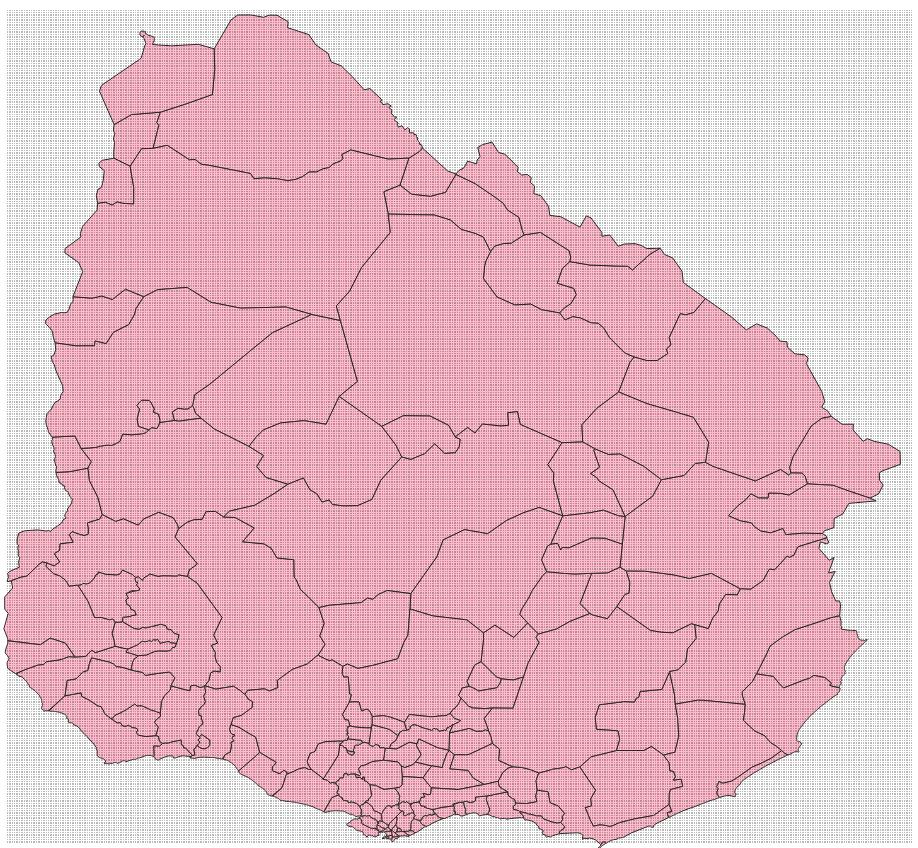
But we still had a problem: Uruguay is not square-shaped! As you can see in the image that has the grid of spots and Uruguay in its entirety, there are a lot of spots that reach Argentina, others Brazil and others the middle of the Atlantic Ocean. I had to find a way of making a reverse georeferencing. What is a reverse georeferencing? It is basically something that, as of a latitude and a longitude, gives you an address (or at least the country).
Once again, I did not want to work with WS/APIS because I did not want to pay, and if you do not pay, they do not let you make massive inquiries. I consulted with Cecilia Guillenea, Federico Balsa y Sergio Garrido (all members of Quanam) because I knew they had worked with geolocation in some of their projects.
Sergio suggested the web service supplied by Agesic that has a few functionalities but unfortunately what that WS exposes does not help me since it looks for street names and things like that, and what I have is a spot with latitude and longitude.
Ceci suggested the map display of Cognos 11. I have used that before and it is really good, the possibility of making custom controls and of using the advanced functions of the Mapbox API through JavaScript gives it an amazing power, but when I tried it with an important amount of, it shattered in 30k spots (or something like that), far from the 260k I have.
Fede suggested to use geopy that has a function in which given certain coordinates it gives you the country those coordinates belong to:
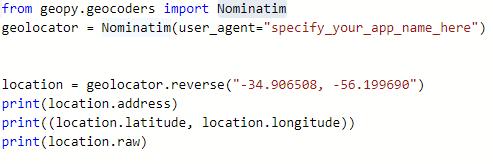
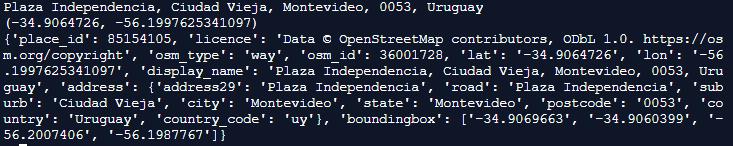
The program is really good and was exactly what I needed, but Fede warned me that there was a limit of requests, and that could be a problem. As a possible solution he told me I could install Nominatim in one of my servers.
Nominatim (form the Latin “by name”) is a tool used to search for data OSM (OpenStreetMap).The problem that was presented before me this time was that apparently it can only be installed on Linux distributions (I use Windows), and the truth is that it did not have the spirit to install virtual machines.
When I was about to give up, I told Guillermo Dotta (Astropay and brother-in-law) who told me that for his thesis he used PostgreSQL and the extension PostGIS.
It gives new types of data (geometric: dots, lines, polygons, etc.) and it also has a lot of functions that allow you to make special enquiries (distance between two dots, if one dot is inside the polygon, etc.)
I started to do some research and I saw that QGIS got along very well with PostGIS. QGIS is a free code Geographic Information System (GIS) that, in addition to connecting to PostgreSQL, also handles shapefile vector files and many other things!

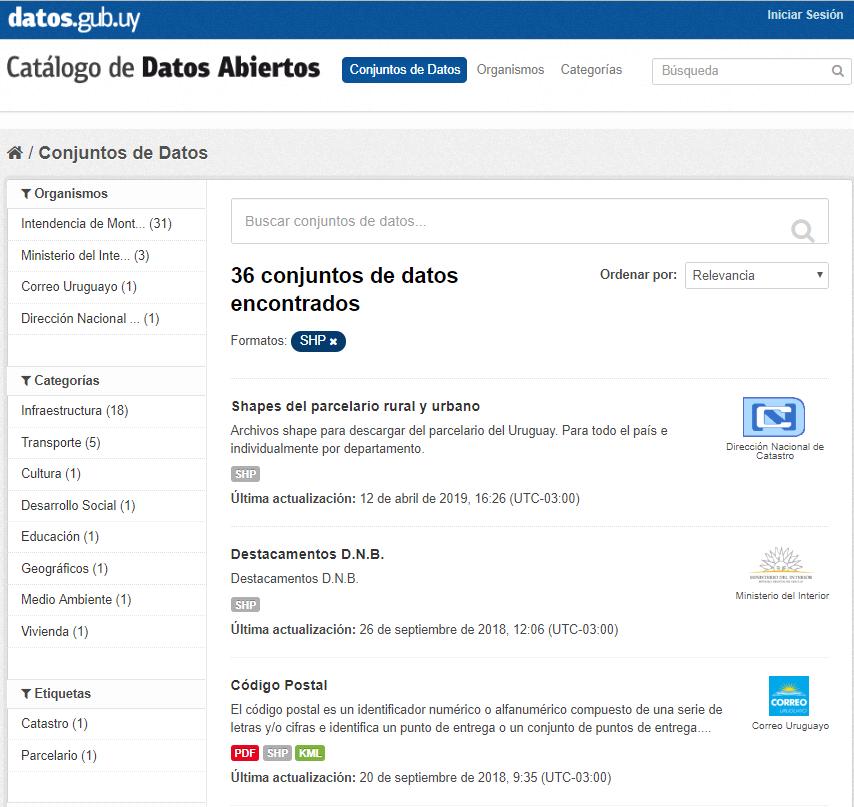
With everything almost ready, the only thing I needed to do next was to find a shapefile with the polygon of Uruguay. I would import it in the QGIS, from the QGIS to a PostGIS table, and then make enquiries. Luckily, I already knew that in the open data catalog there are shapefiles of a lot of things (zip codes, locations, etc.)
Once the database and the plug-in is installed to be geospatial and with tables containing data on points, zip codes, neighborhoods, sections and others, there are many fun things that can be done:
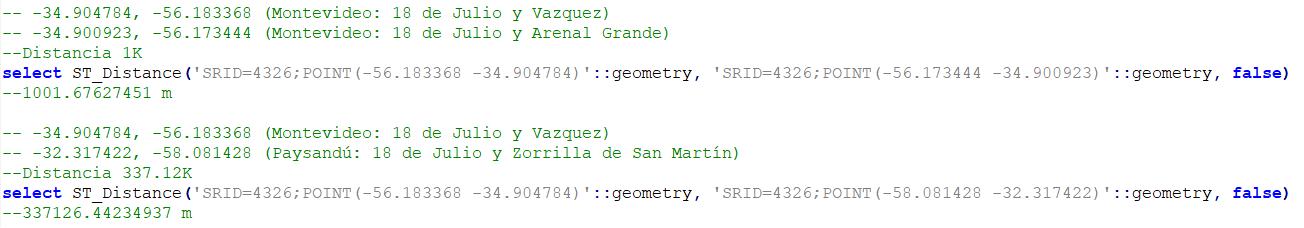
Find the distance between two spots.
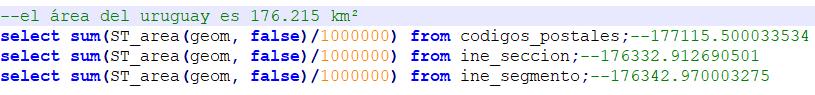
Find the area of Uruguay:
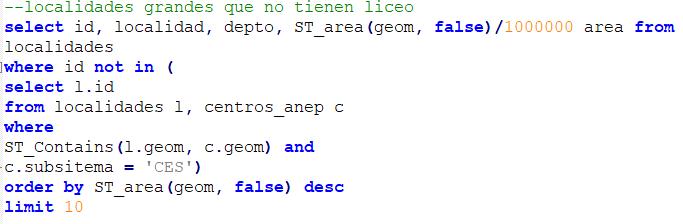
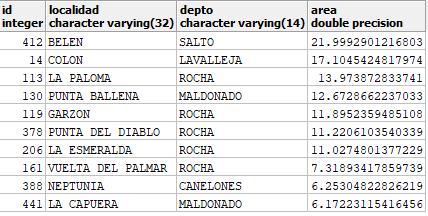
Search for large locations that do not have secondary schools
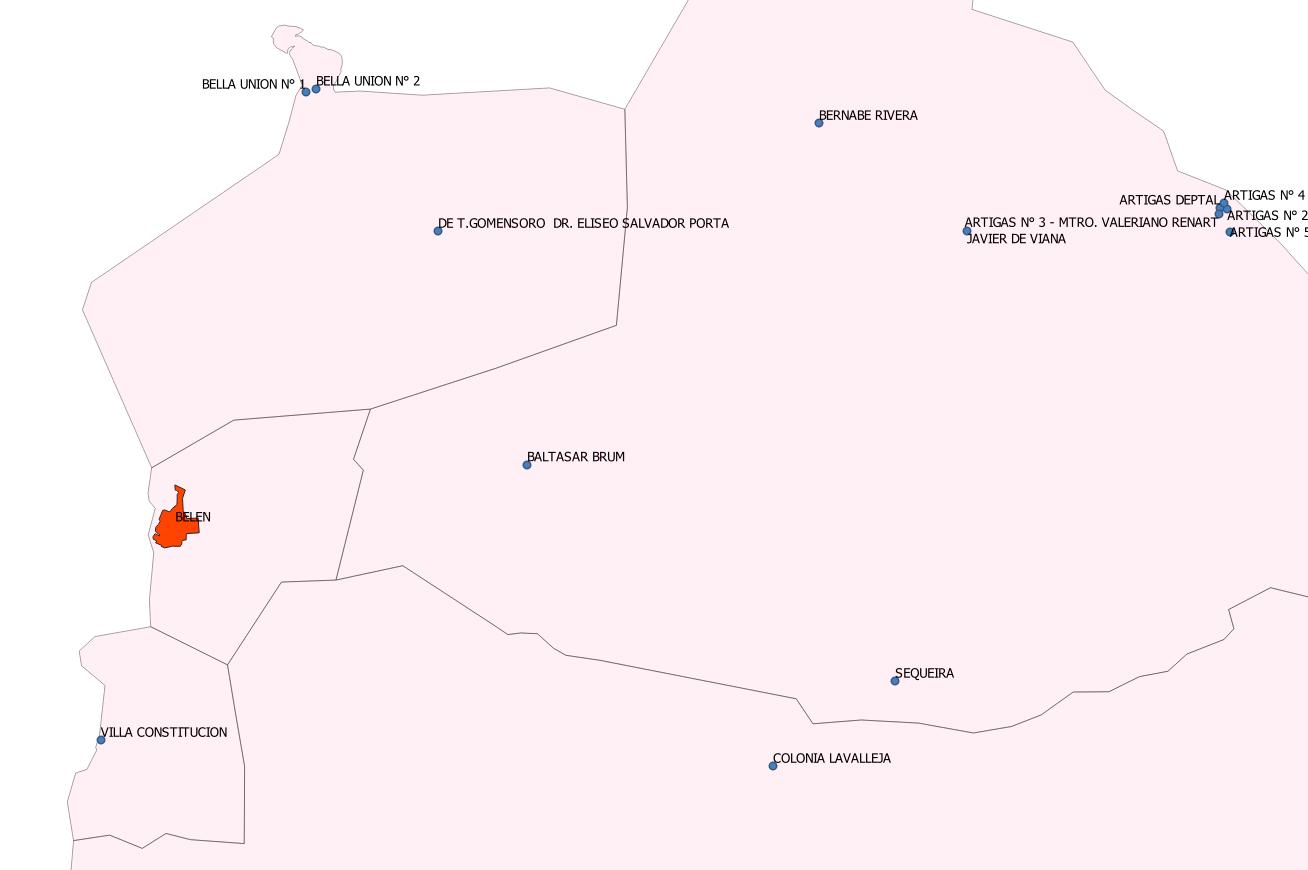
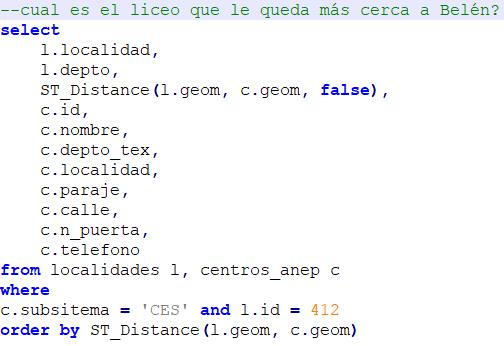
See which secondary school is closest to the largest town without a secondary school

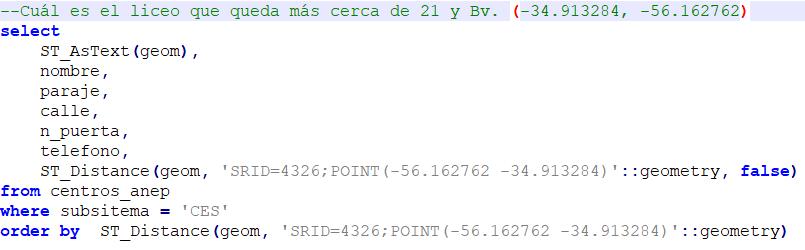
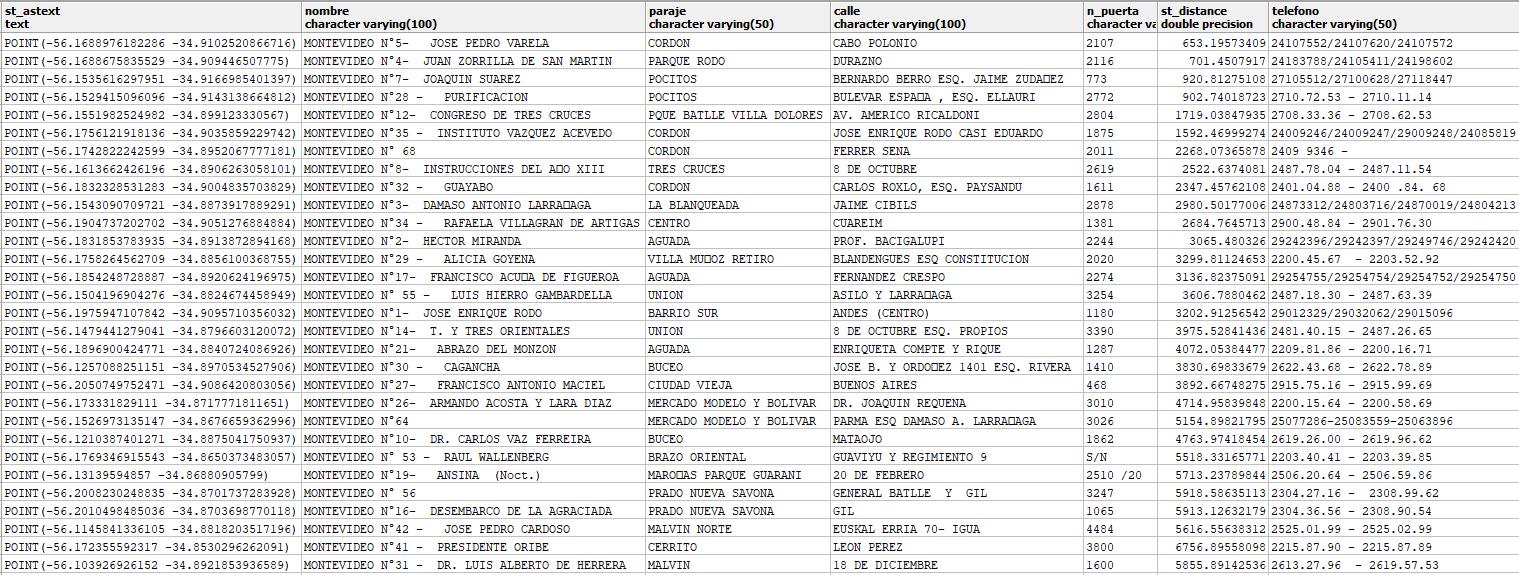
Which schools are closer to 21 de Setiembre and Boulevard Artigas?
Given that I had a map of the localities of Uruguay it occurred to me that, instead of using all the grid of spots, I could cross this information so that the candidate spots are located in a locality (where people live) and not lost in the middle of nowhere.
Excellent, now by means of a simple Query we can see the places where the secondary schools are farther away.
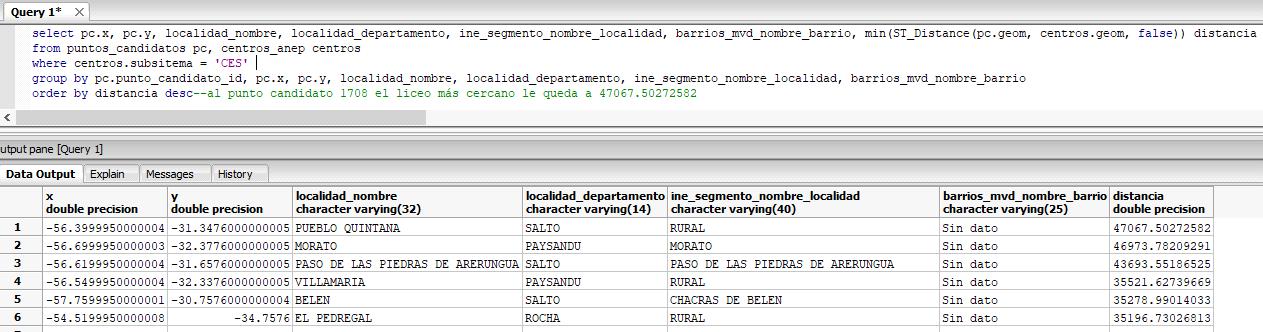
Let’s investigate a little more. According to Wikipedia, Pueblo Quintana has 67 inhabitants, Morato has 218, while Paso de las Piedras de Arerunga does not appear. Also, we need to take into account the amount of inhabitants in these towns that could be interested in attending these secondary schools.
Apparently, only taking into account the spot in which a locality is and the distance to the nearest secondary school is not as useful as I thought. The amount of inhabitants that live close to the selected spot that could attend the secondary school and the socioeconomic information of those inhabitants must be taken into account. Patricia Martell, Soledad Gaitán y Fernando López (all members of Quanam), specialists in datascience, had already warned me that it was not going to work that easily.
But nothing will make me stop and in the next episode I will focus on another approach that convinces me more.
Business Analytics & Information Management consultant.