
The fight against coronavirus COVID-19: Quanam’s contribution
Introduction
Since the very first cases in Uruguay were diagnosed on Friday, 13 March 2020, the fight against coronavirus COVID-19 has become the main issue in the country. Consequently, the government has been taking steps to slow down its spread, as its transmission capacity is far higher than other diseases. Its R0 factor is 2.68, meaning the number of people that each patient can infect. It is assumed that when R0 is below 1, the epidemic is controlled.
The R0 factor is calculated and can vary. This is precisely where we want to act to slow down the spread.
Health authorities seek to reduce spread, which is known as “curve flattening”, to avoid hospitals’ breakdown. The best solution is detecting infected people and sending them and their close contacts to quarantine at home. People should abide by keeping social estrangement, avoiding meetings, and staying at home.
Therefore, it is crucial to understand how social interaction works (real life interaction! Neither Facebook, nor Twitter or Instagram!), since they are key in virus transmission. Interactions are made explicit between places, back and forth, transmission waves, such as schools, offices, events, and home.
What we mean by “real” social network refers to our family, friends, co-workers, and neighbors, but also interaction with strangers at events, pubs, and shops. These are the types of connections we intend to analyze and model because they are the virus spreading paths by which the virus spreads.
Understanding the structure of these networks, and the virus’ trajectory, may show us how to interrupt and predict, to keep away from it.
Background
We had already used a similar model to study plots of land epidemically related, for the National System of Cattle Information (Ministry of Cattle, Agriculture and Fishing). Now, we had to give it a new gist to make our contribution to fight against coronavirus COVID-19.
On Saturday 14th we began working on the model which is based on some assumptions such as number of contacts per person, distance to work, size of the working place, home size, an individual’s movements, and taking part in events, among others. Fake data was loaded to test the model to check the concept and determine whether it adds value and is useful to fight against coronavirus COVID-19.
Not all information is easily available, since you must be careful with privacy policies of personal data), but you don’t need to have all the information to start working. There are alternative sources of information:
- BPS (Social Welfare Bank) provides where people work.
- ASSE (State Health Services) or MSP (Ministry of Public Health) supplies information on individuals and their hospital (bed availability, coverage of people at major risk, among others).
- SIIAS (Social Area Integrated Information System) shows family groups.
- Migrations National Directorate has a registry with data on who have come into the country and their accommodation, for instance.
- Metropolitan Transportation System + transport companies + ANTEL mobility information (depending on the antennas to which the cell phones are connected) can supply mobility data.
- Tickantel and other platforms to find out what events people attended
Credit/debit cards have information on which stores someone has bought. - ANEP (National Administration of Public Education), to know which school every child attend.
- Enrolments at universities, sports/social clubs, etc.
Historically, the virus impact evolution on social networks, and their role in terms of spreading respiratory diseases have been quite limited due to lack of precise data on transmission outside home, and because the statistical methods were not the appropriate ones. Nowadays, there is much more information available everywhere, and I.T. development to face the problem.
It should be noted, though, that it is pivotal to know where data come from, to make sure it is a valid source. Inaccurate information may entail serious consequences which will directly affect decision making. I would rather not have a watch and be Sun guided than having a watch showing inaccurate time.
Centrality measures
A fundamental part of the analysis are the centrality measures, mainly 4: degree, proximity, intermediation and own vector.
- Degree: corresponds to the number of interactions a hub has with others, something like the “number of friends”.
- Proximity: the average of the shortest distances from one hub towards all the others. It is visualized as the closest person (fewer jumps) among the rest.
- Intermediation: how many times a hub is like a bridge between two other hubs, along the shortest path. It can be compared to a leg airport between one place and another.
- One’s own vector: it measures the influence of a hub in a network. In other words, it is like an individual who has many social connections, who are widely connected too.
These relations are important, because people who are at the centre of the network are often more likely, and the first to get the virus. Conversely, people on the network’s edges, those with few friends and contacts, are the least likely to get sick. They may never get the virus, but if they do, it will be late during the epidemic.People in the centre of the network ( people with much interaction with friends and contacts) will be more likely to pass the virus to a major number of people. This information can be used to create an epidemic early alert system, to plan proactively against epidemic breakouts.
The Model
Here follow the entities that were modelled using IBM i2, that it´s our contribution to fight against coronavirus COVID-19.
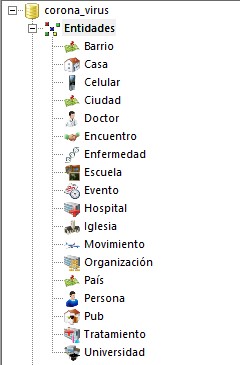
In turn each of these entities has attributes, for example, from a House you know the street, the door number, apartment number, size, and latitude and longitude to be able to easily locate it geospatially. This entity is linked (via a link or bond) to the Neighbourhood, which in turn links to a City, and this one to a Country.
Meeting is used to model a meeting , or similar, between 2 or more people, and it can also find its connection with Pub.
The entity Disease was modelled to link an Individual to their pre-existing diseases, for instance: diabetes, heart, or respiratory problems, to learn their percentage of risk to contract the virus.
An Event may stand for several situations, such as a football match, a concert, a wedding, or a birthday party. An Event takes place on a date, at a time and place, and its geolocation is found with coordinates.
When a Movement is created (which has date, time, kind of vehicle and plate number), additional links are created: one to the City of origin, another to the destination City, and as many as required to involve all the People who have taken part in this Movement.
Organization represents companies, clubs, among others.
A Treatment (with its corresponding date) is linked to the Doctor, the Hospital, and the Individual.
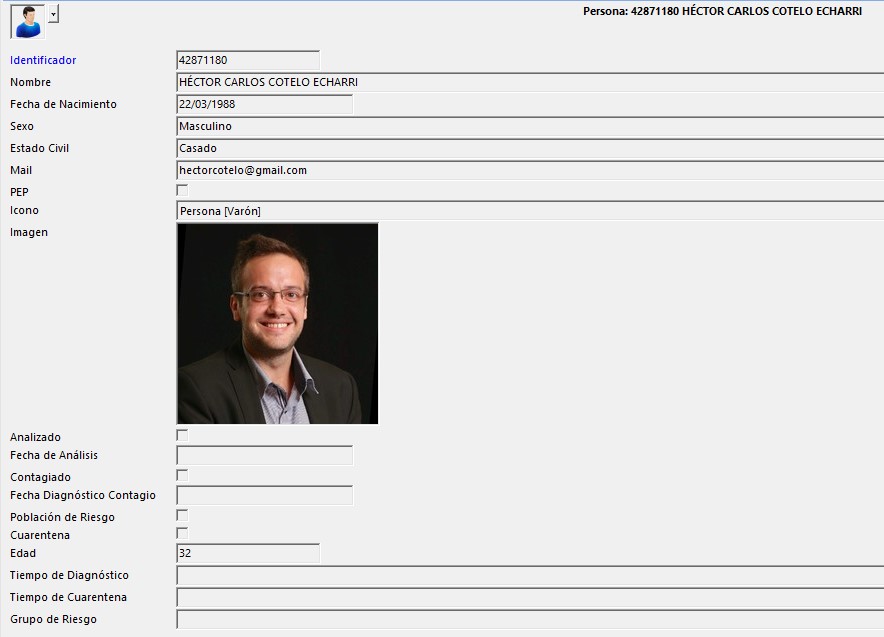
The following image shows an entity Individual, with my data:
Probable Analysis
Please note that the database was loaded with fictitious information to build a story. There is some real-life information so that the story makes sense.
Once an entity is on the graph, it can be expanded to see all its relations. In my story:
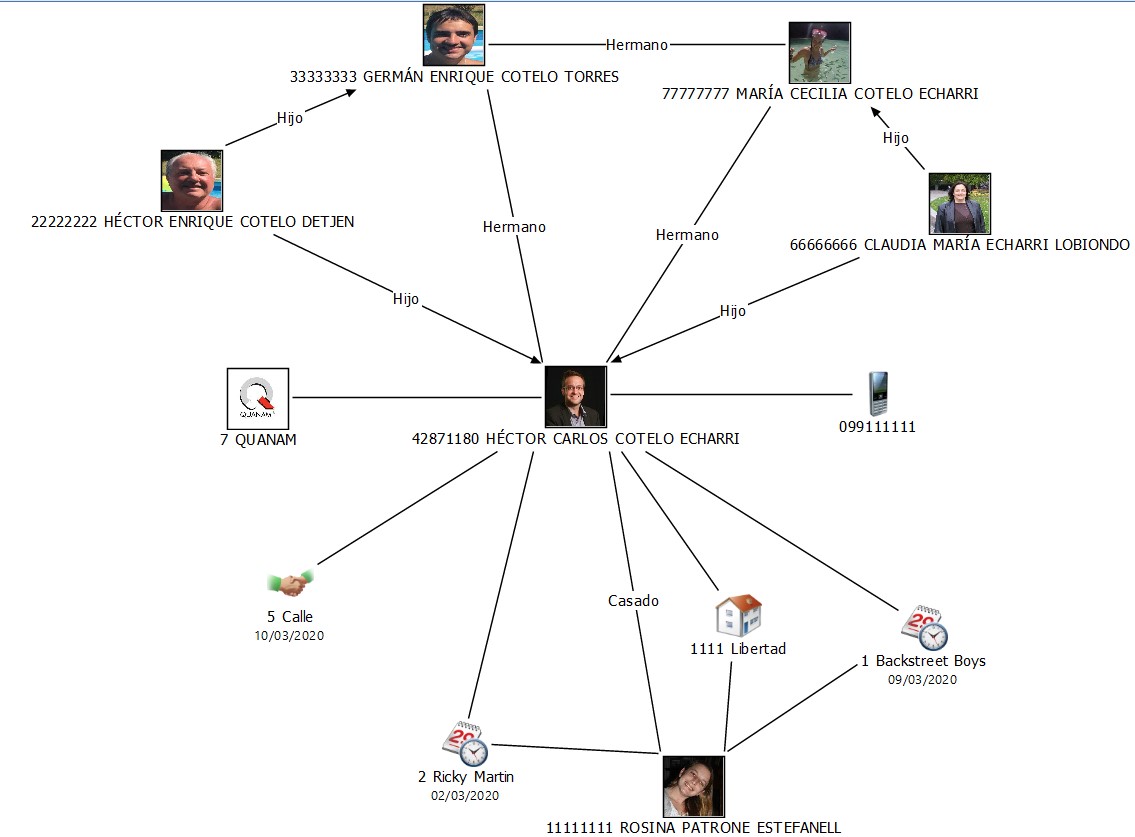
You can see my parents and brothers, that I work at Quanam, that I had an encounter with someone on the street on 10/03/2020 (we still don’t know who), that I live with my wife in the same house, and that we went to two shows together, and my mobile.
In turn, you can expand those entities to see what they connect to and thus put the social network together:
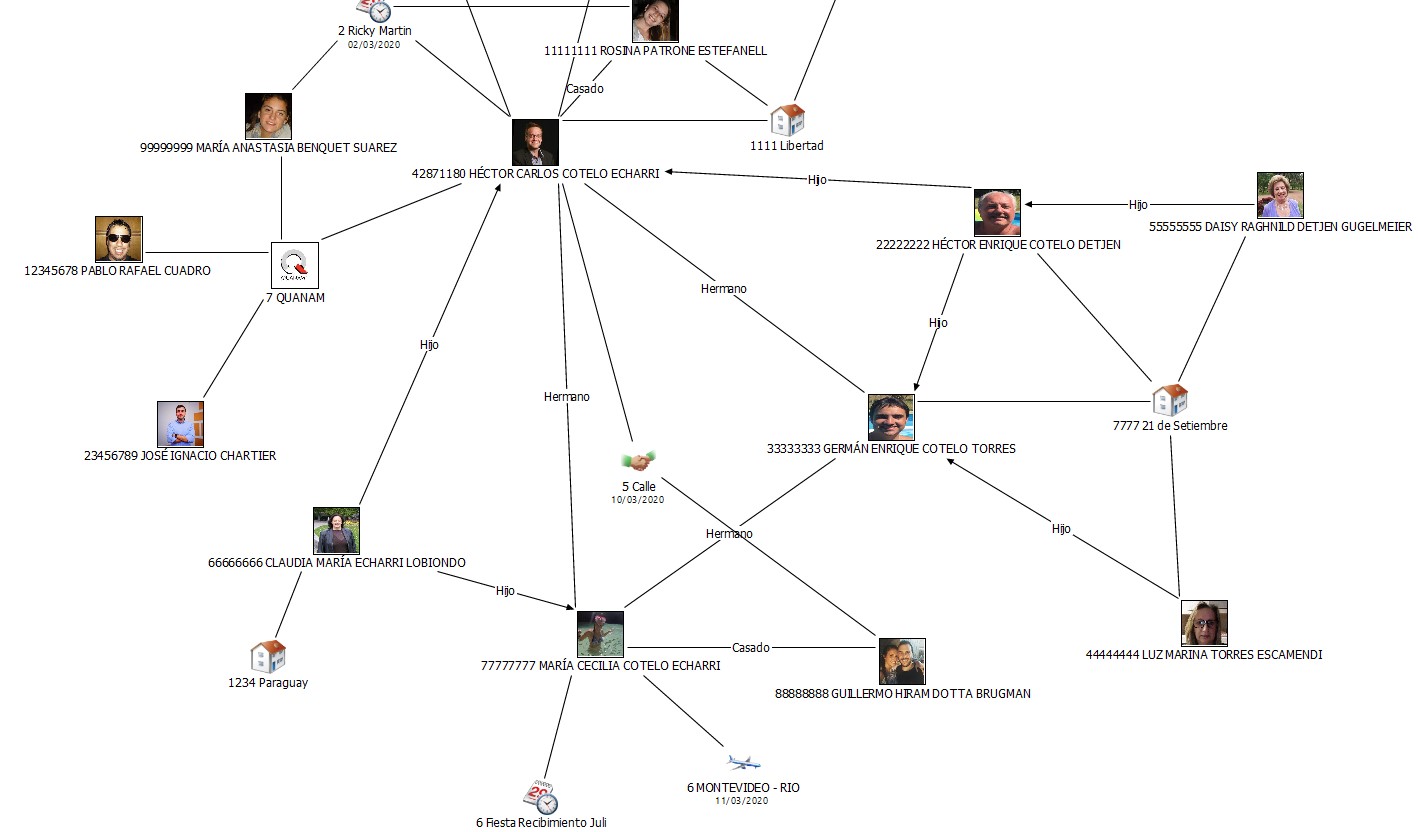
In the image we can see my colleagues at Quanam, in the case of Anne, we can see that she also went to Ricky Martin’s concert, we see the house where my father, his wife, my brother and my grandmother live; my sister who is married to Guillermo, the person whom I met on the street, and so on.
You can keep expanding to analyze mobility, people at Quanam seem to love traveling so I am going to expand my three companions:
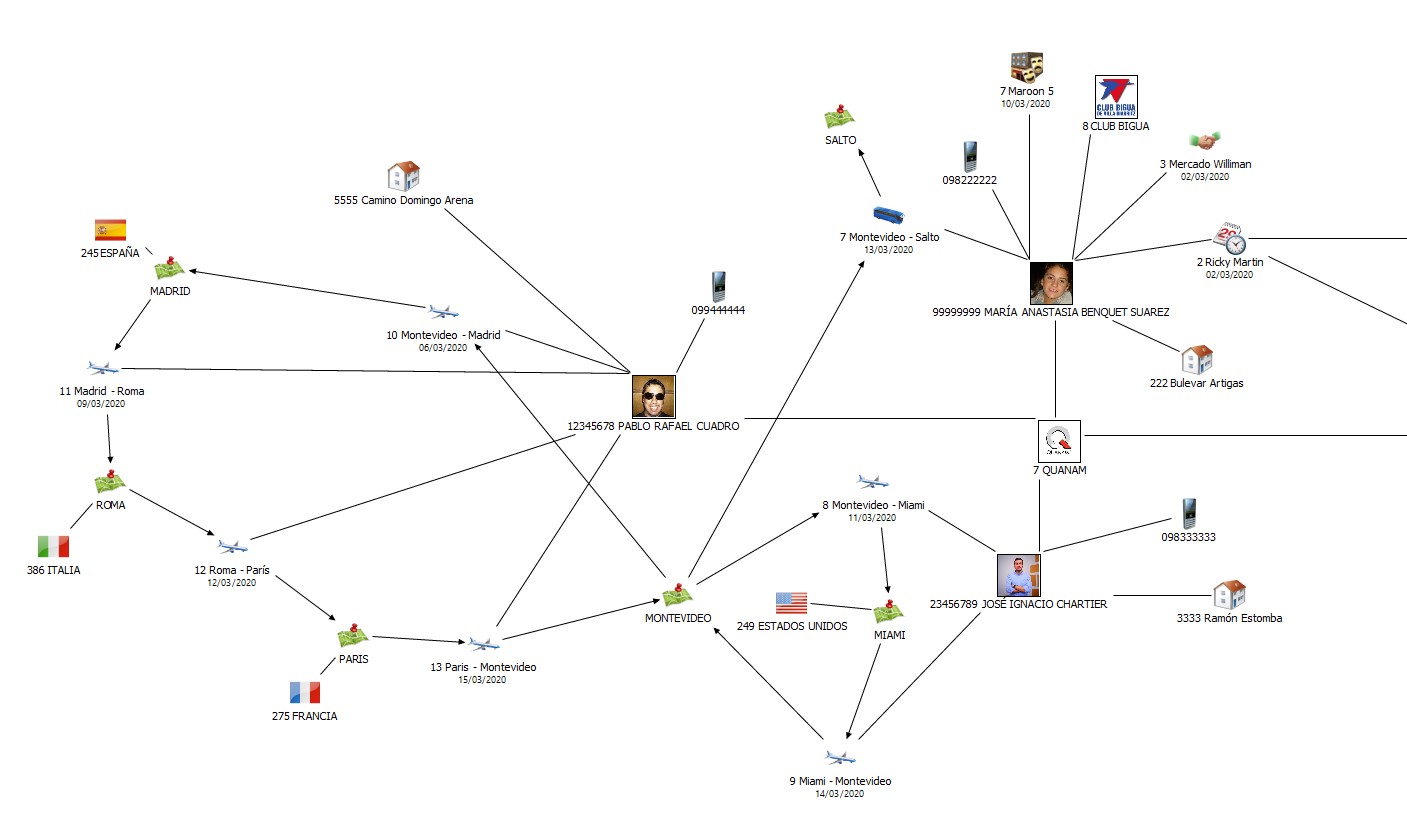
Now you can see where they live, their phones, their activities, trips, etc.
If we expand Madrid to try to see other Movements “Madrid – Montevideo” we find Carmela Houtou’s journey, the first patient to be detected with the virus in Uruguay, and if we expand around her t we can see all her links:
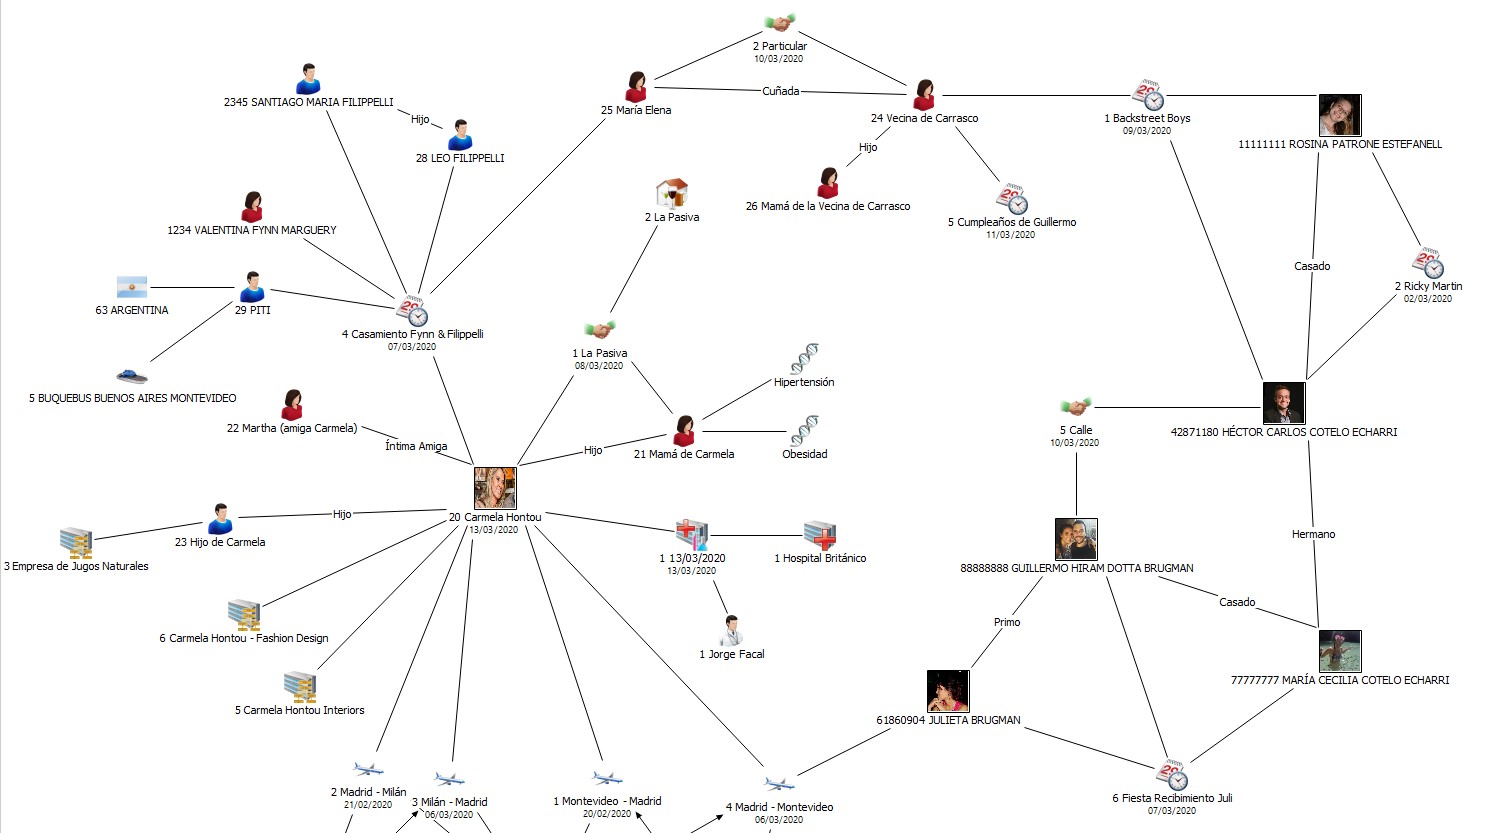
The novelty is that the graph shows that on her return flight there was Julieta, Guille’s cousin (my brother-in-law) and that both of them shared their graduation party. In turn, I had met Guille on the street. This way you can do research on how the virus spreads.
A good functionality this tool has is that information can be visualized like a timeline:
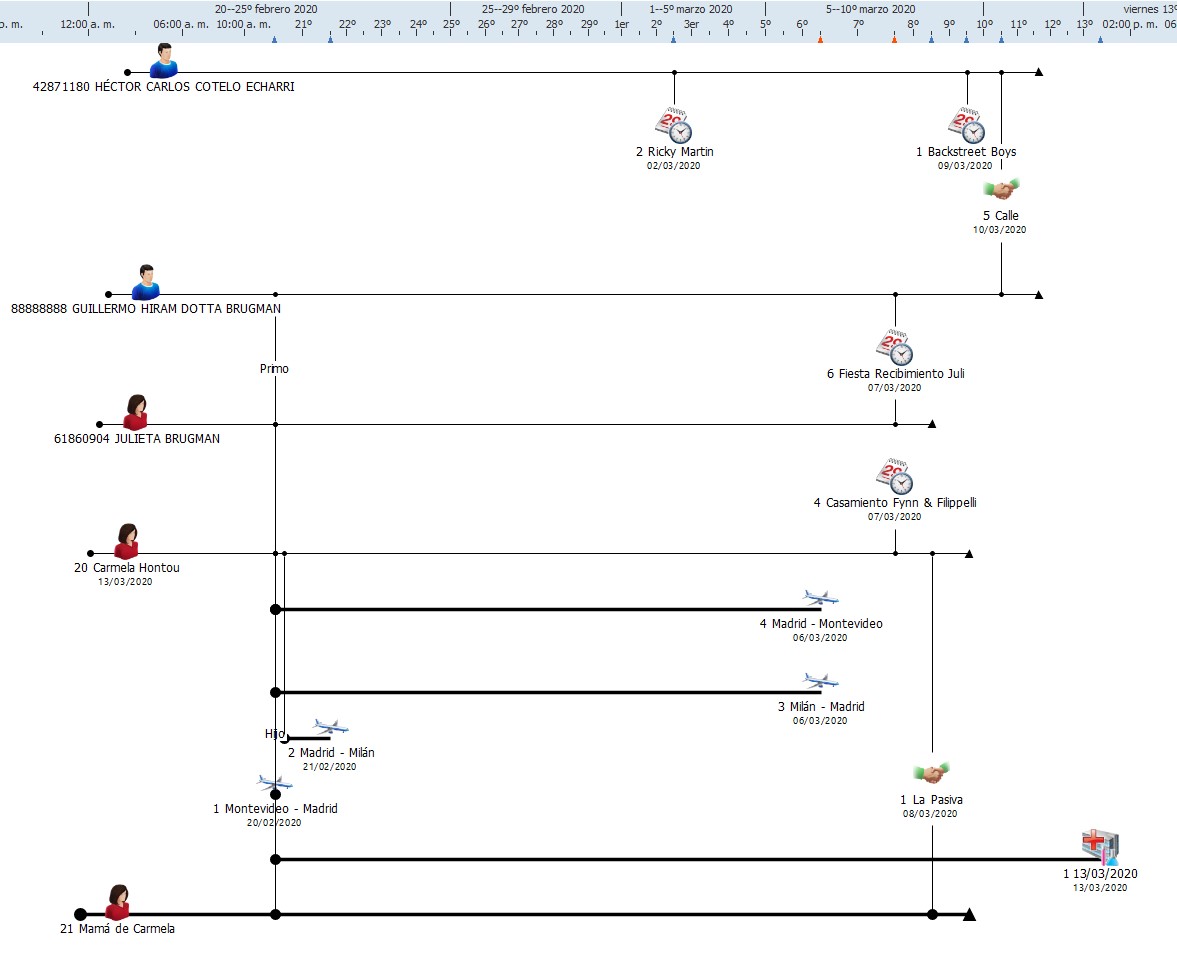
This visualization makes events’ sequence clearer.
Additional entities and attributes added to the graph may hinder its reading.

Therefore, the conditional format is useful. In this case, we can enlarge key entities, for instance, people at high risk:

Centrality measures (above mentioned theoretically), which are pivotal, are automatically provided by the tool.
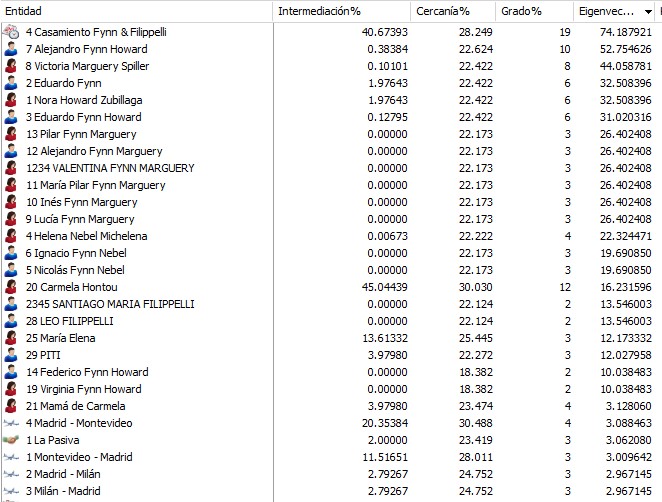
It can be appreciated that the most important entity (the centrality measure with major value, “own vector”) is the marriage Carmela attended, as well as many other guests, because are closely related relatives.
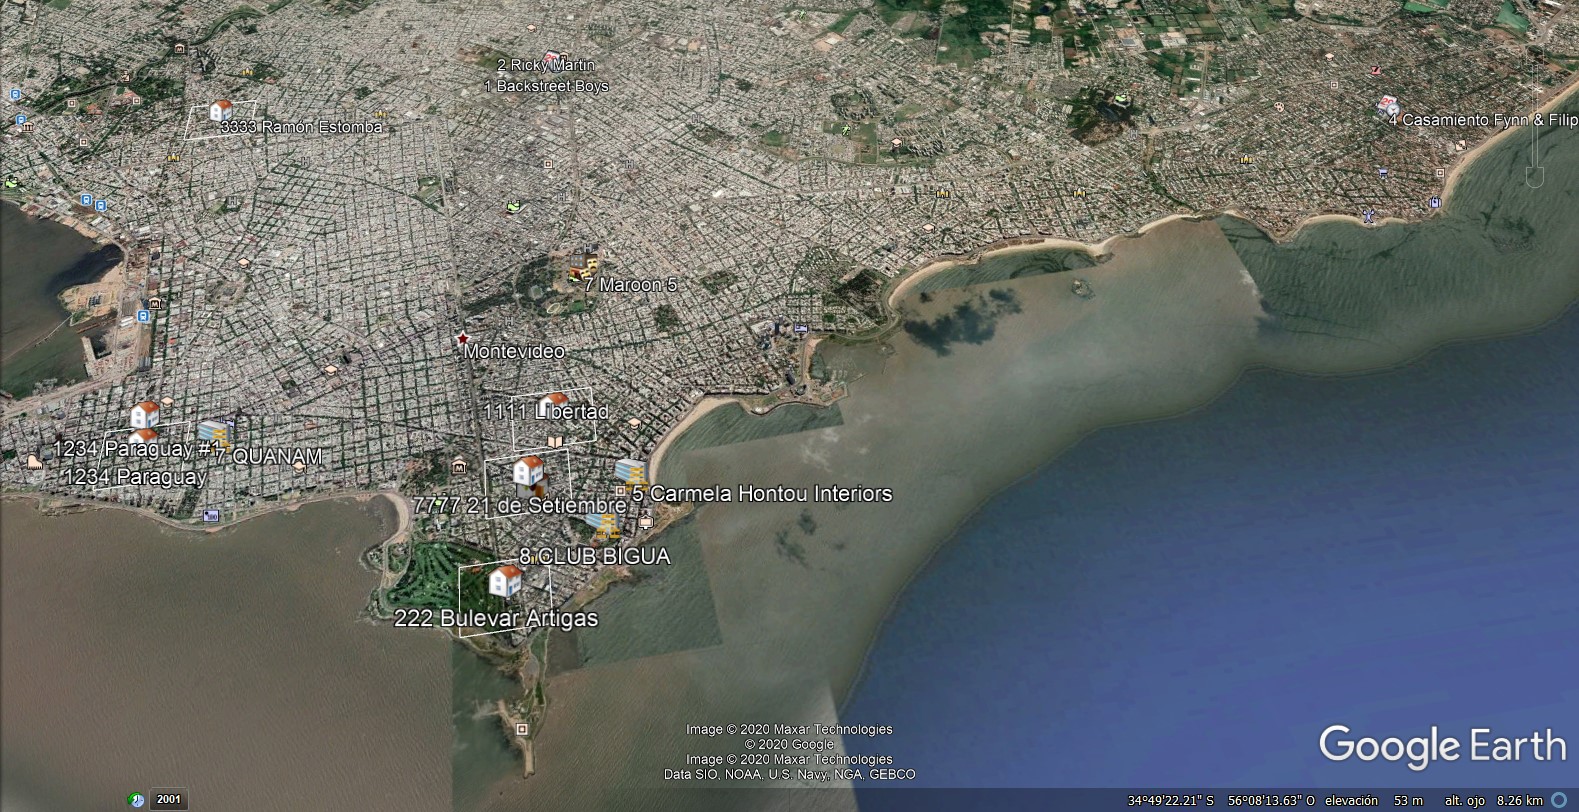
The last feature that I think is worth highlighting in this model to fight against the coronavirus COVID-19, is the possibility of visualizing data geospatially, since the tool is natively connected with Google Earth and ESRI:
Conclusions
Coronavirus COVID-19 is an infectious virus that has a contagion high rate which affects a large number of people. It is a easily spread disease, so much so, that if the curve is not flattened, the health system is prone to be overflowed.
The development of healthcare computer applications is increasing as an effective solution to fight the coronavirus COVID-19.
In this case, the concept proof indicates that Social Network Analysis can be an effective solution for presenting the status of the outbreak and analyzing cases of infection.
Data & Analytics and Information Management Consultant